The Cross-Platform Analytics feature in Social Champ allows you to track and compare the performance of your multiple connected social media profiles in one place. Instead of checking each platform separately, you can view key insights, monitor growth, and identify which channels bring the most engagement, audience etc. all from a single dashboard.
This feature is perfect for marketers, businesses, and agencies that manage multiple social media platforms and want to make data-driven decisions with ease.
Navigating to Cross-Platform Analytics
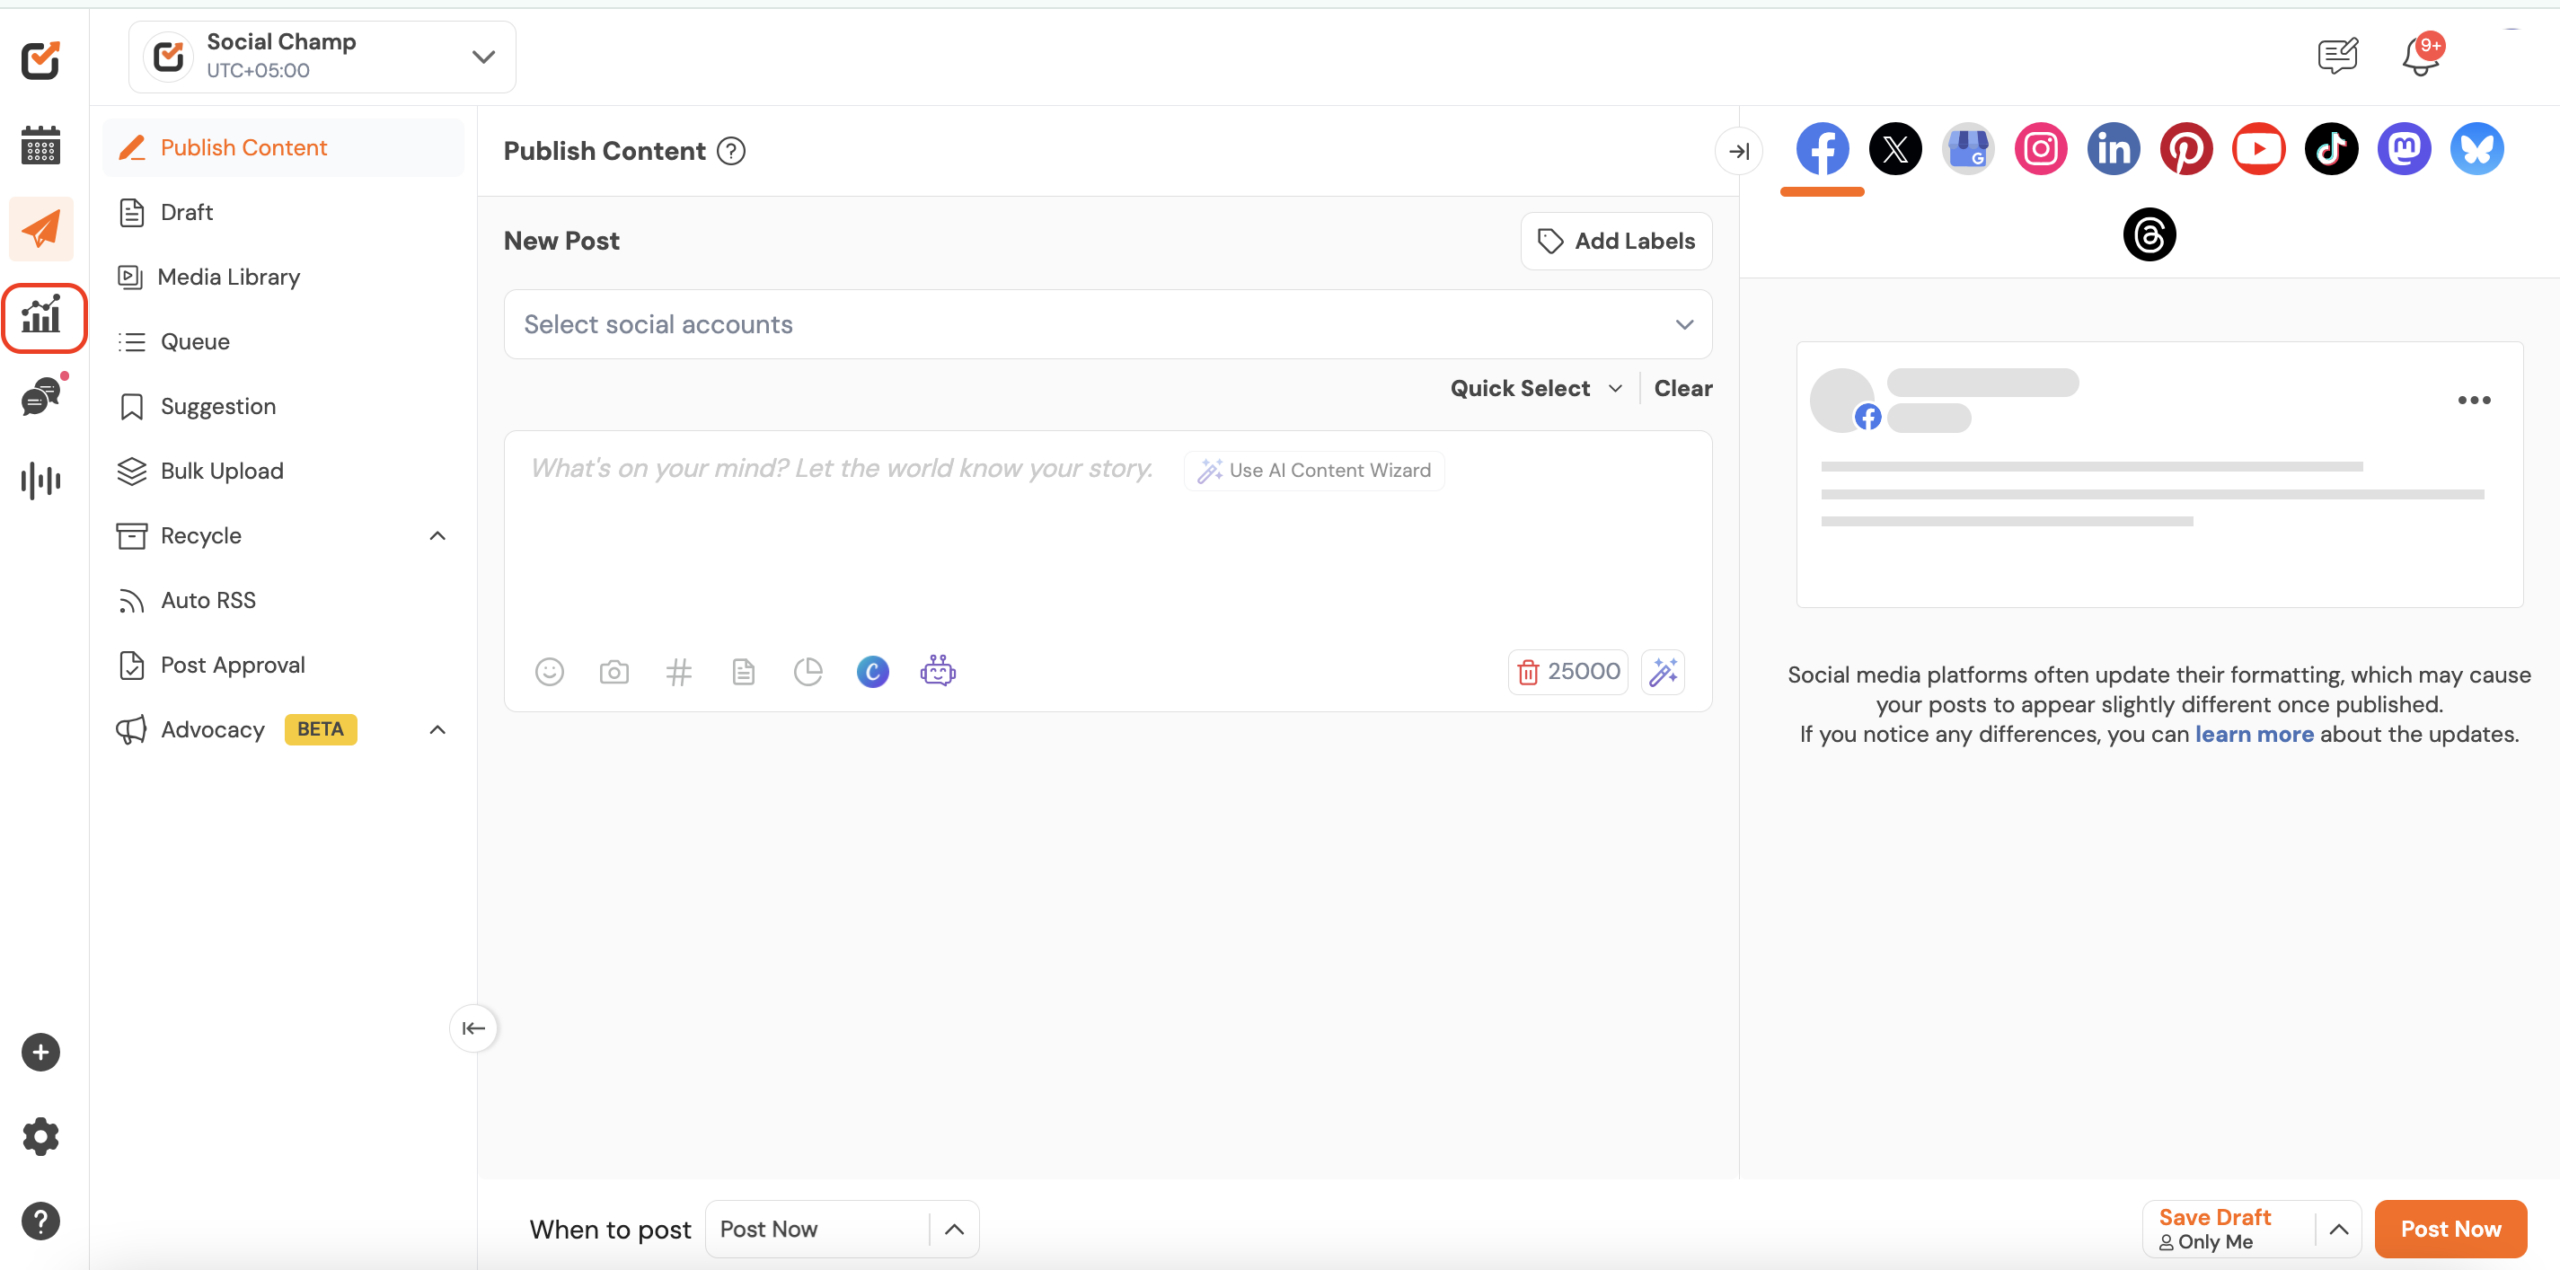
- Log in to your Social Champ Account.
- From the left pannel, click on Analytics.
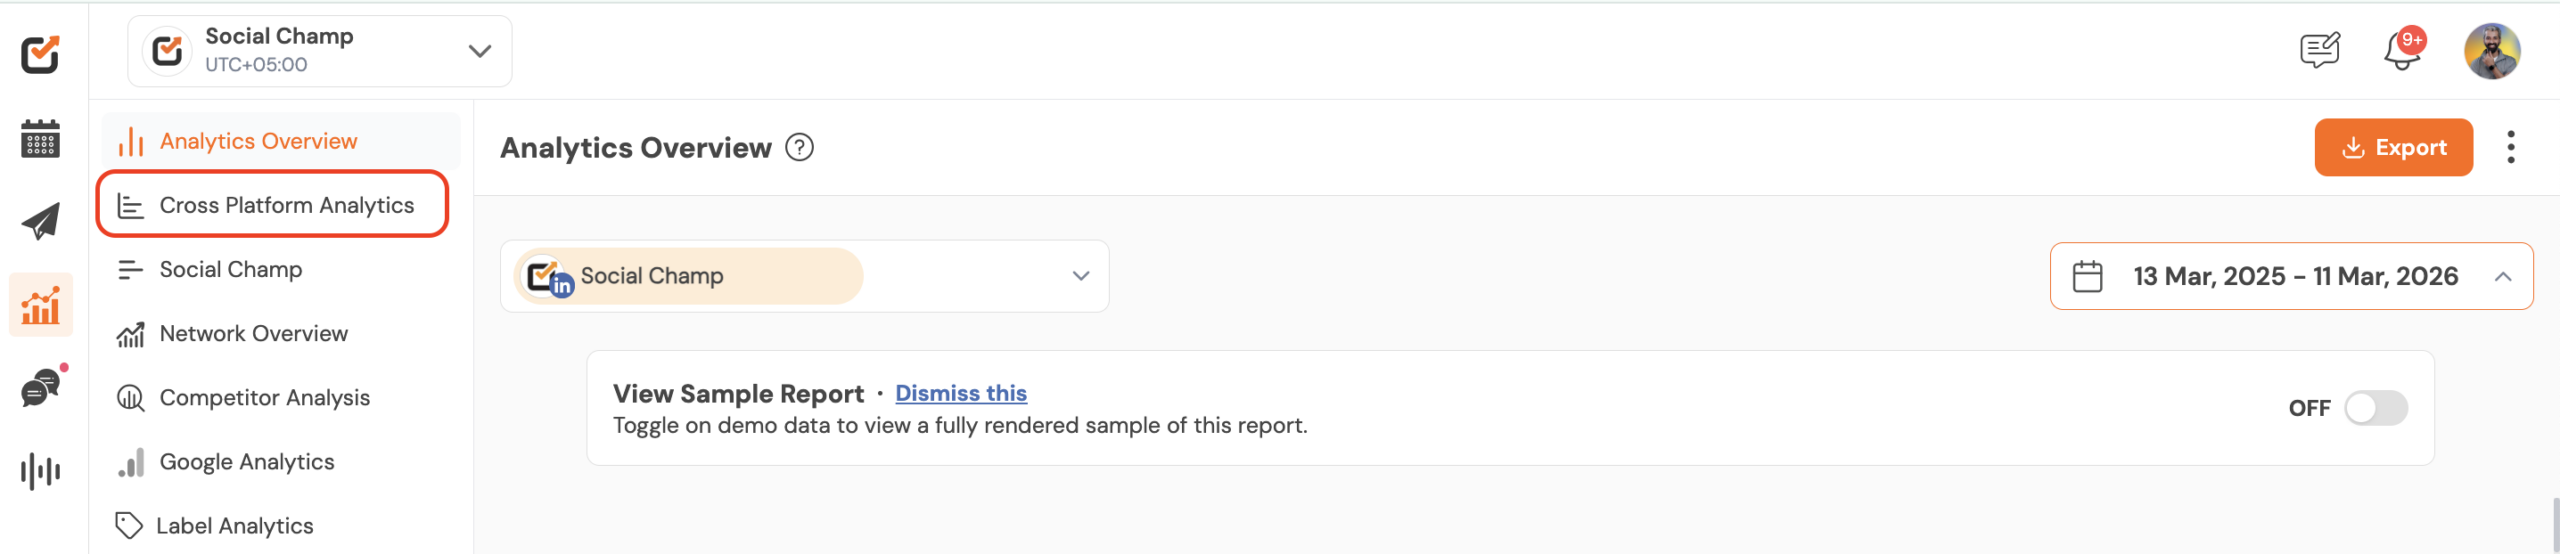
Understanding Your Analytics Dashboard
- Select Cross-Platform Analytics from the second left panel.
- Select the specific platforms to see detailed metrics and choose the date range.
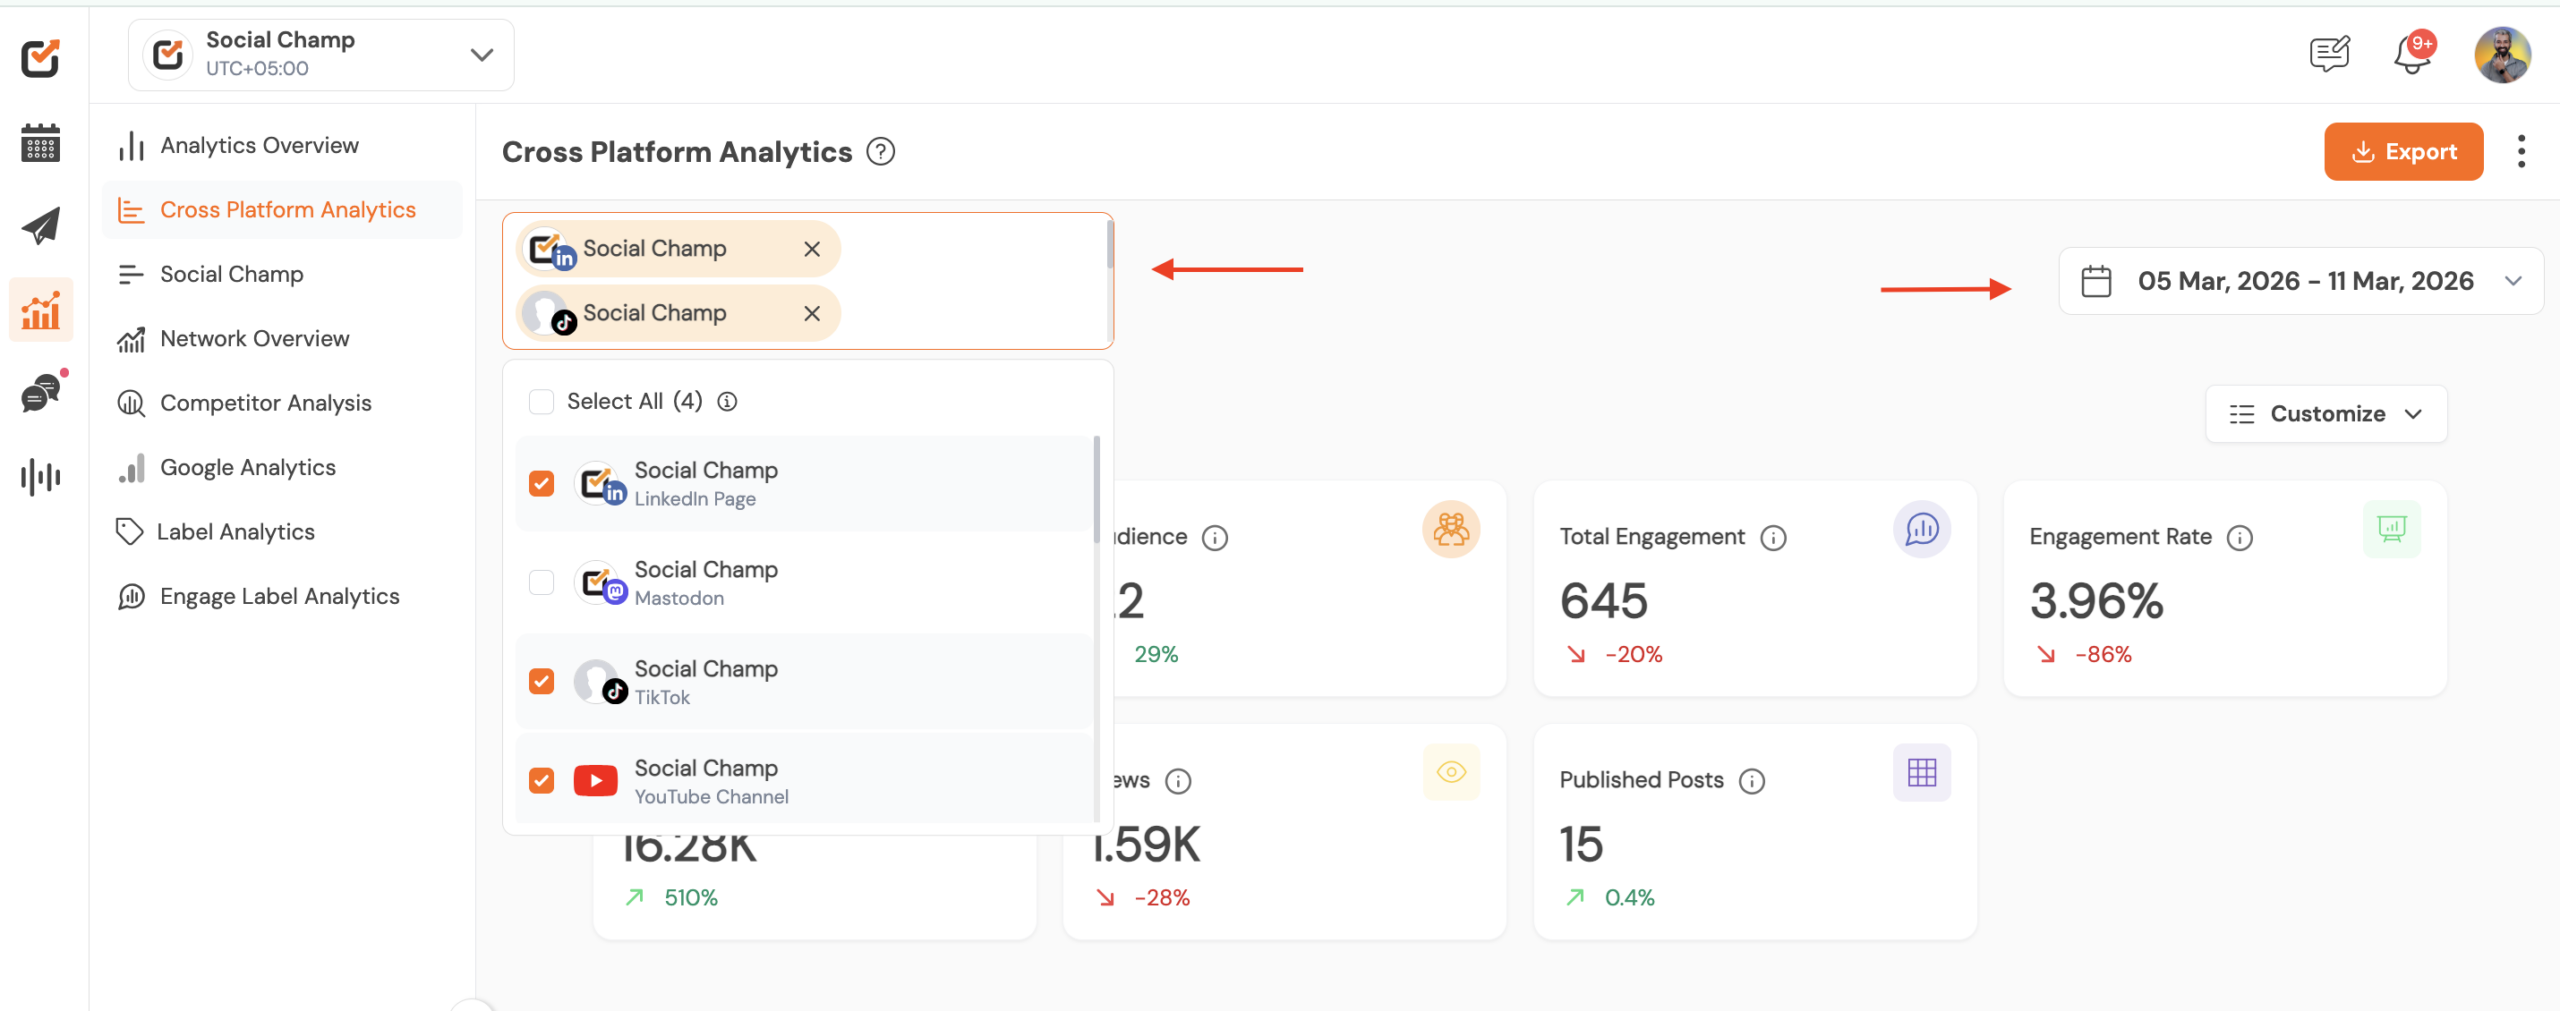
For the selected social media accounts you can analyze and compare the common metrics like, Audience, Engagement, Impresions, views and Published posts. The detailed graphical and numeric breakdown is given below.
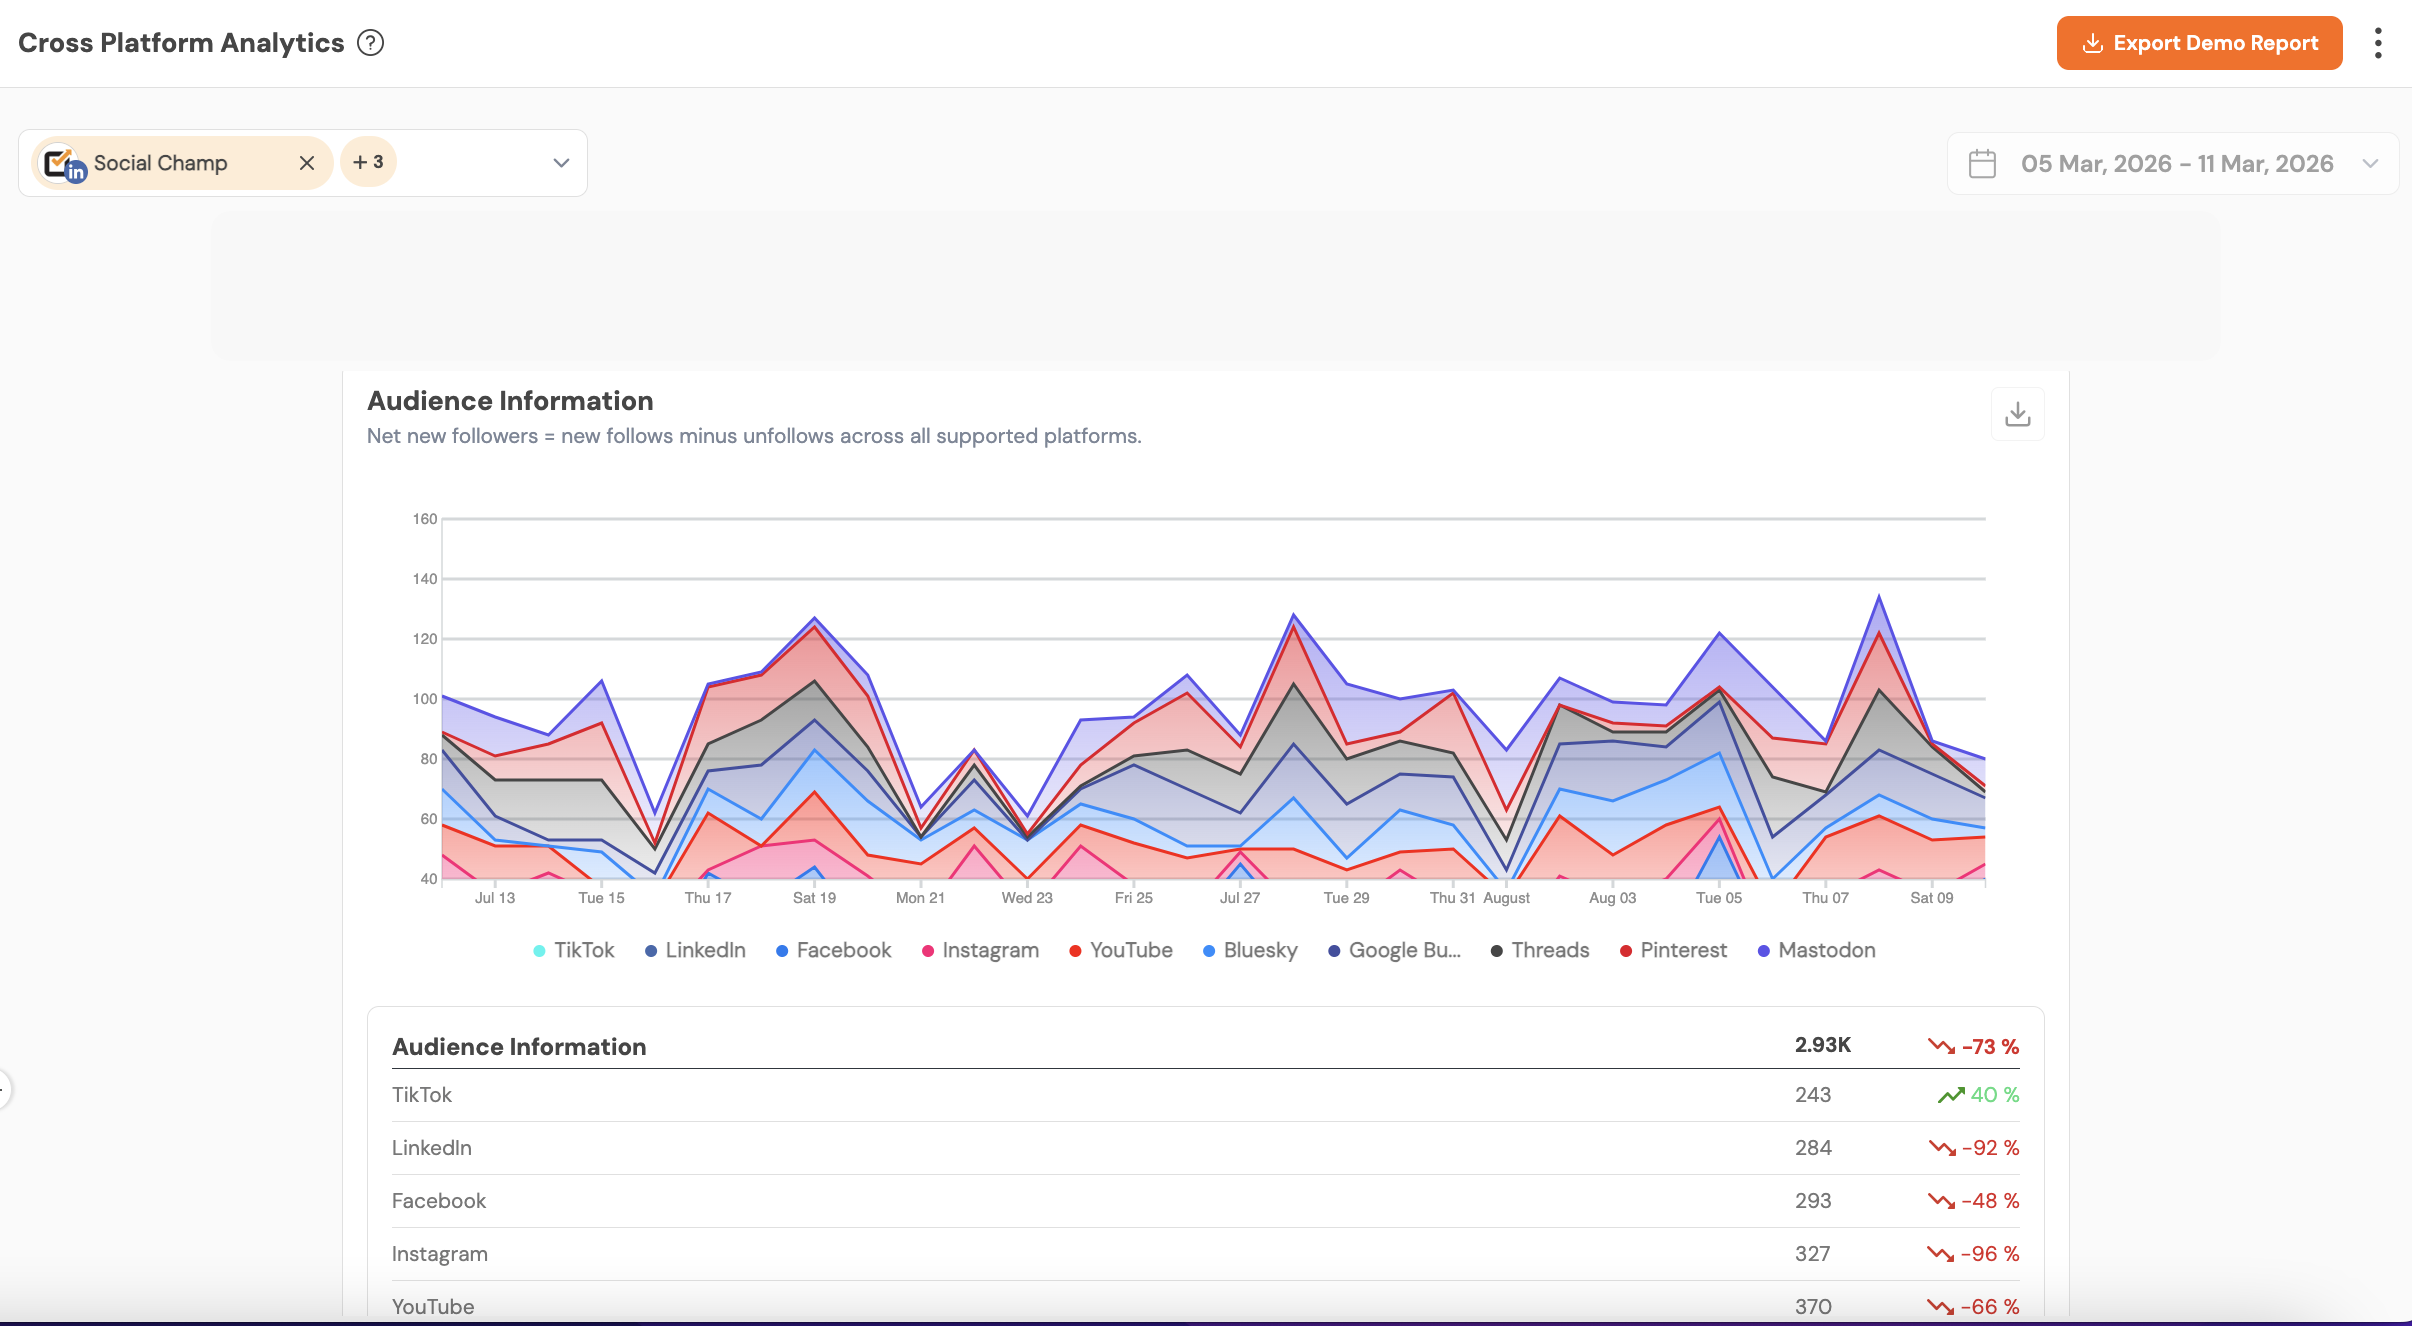
Audience Information
Aggregate audience data such as follower counts. It helps you understand how much audience you have grown in over a specified period of time.
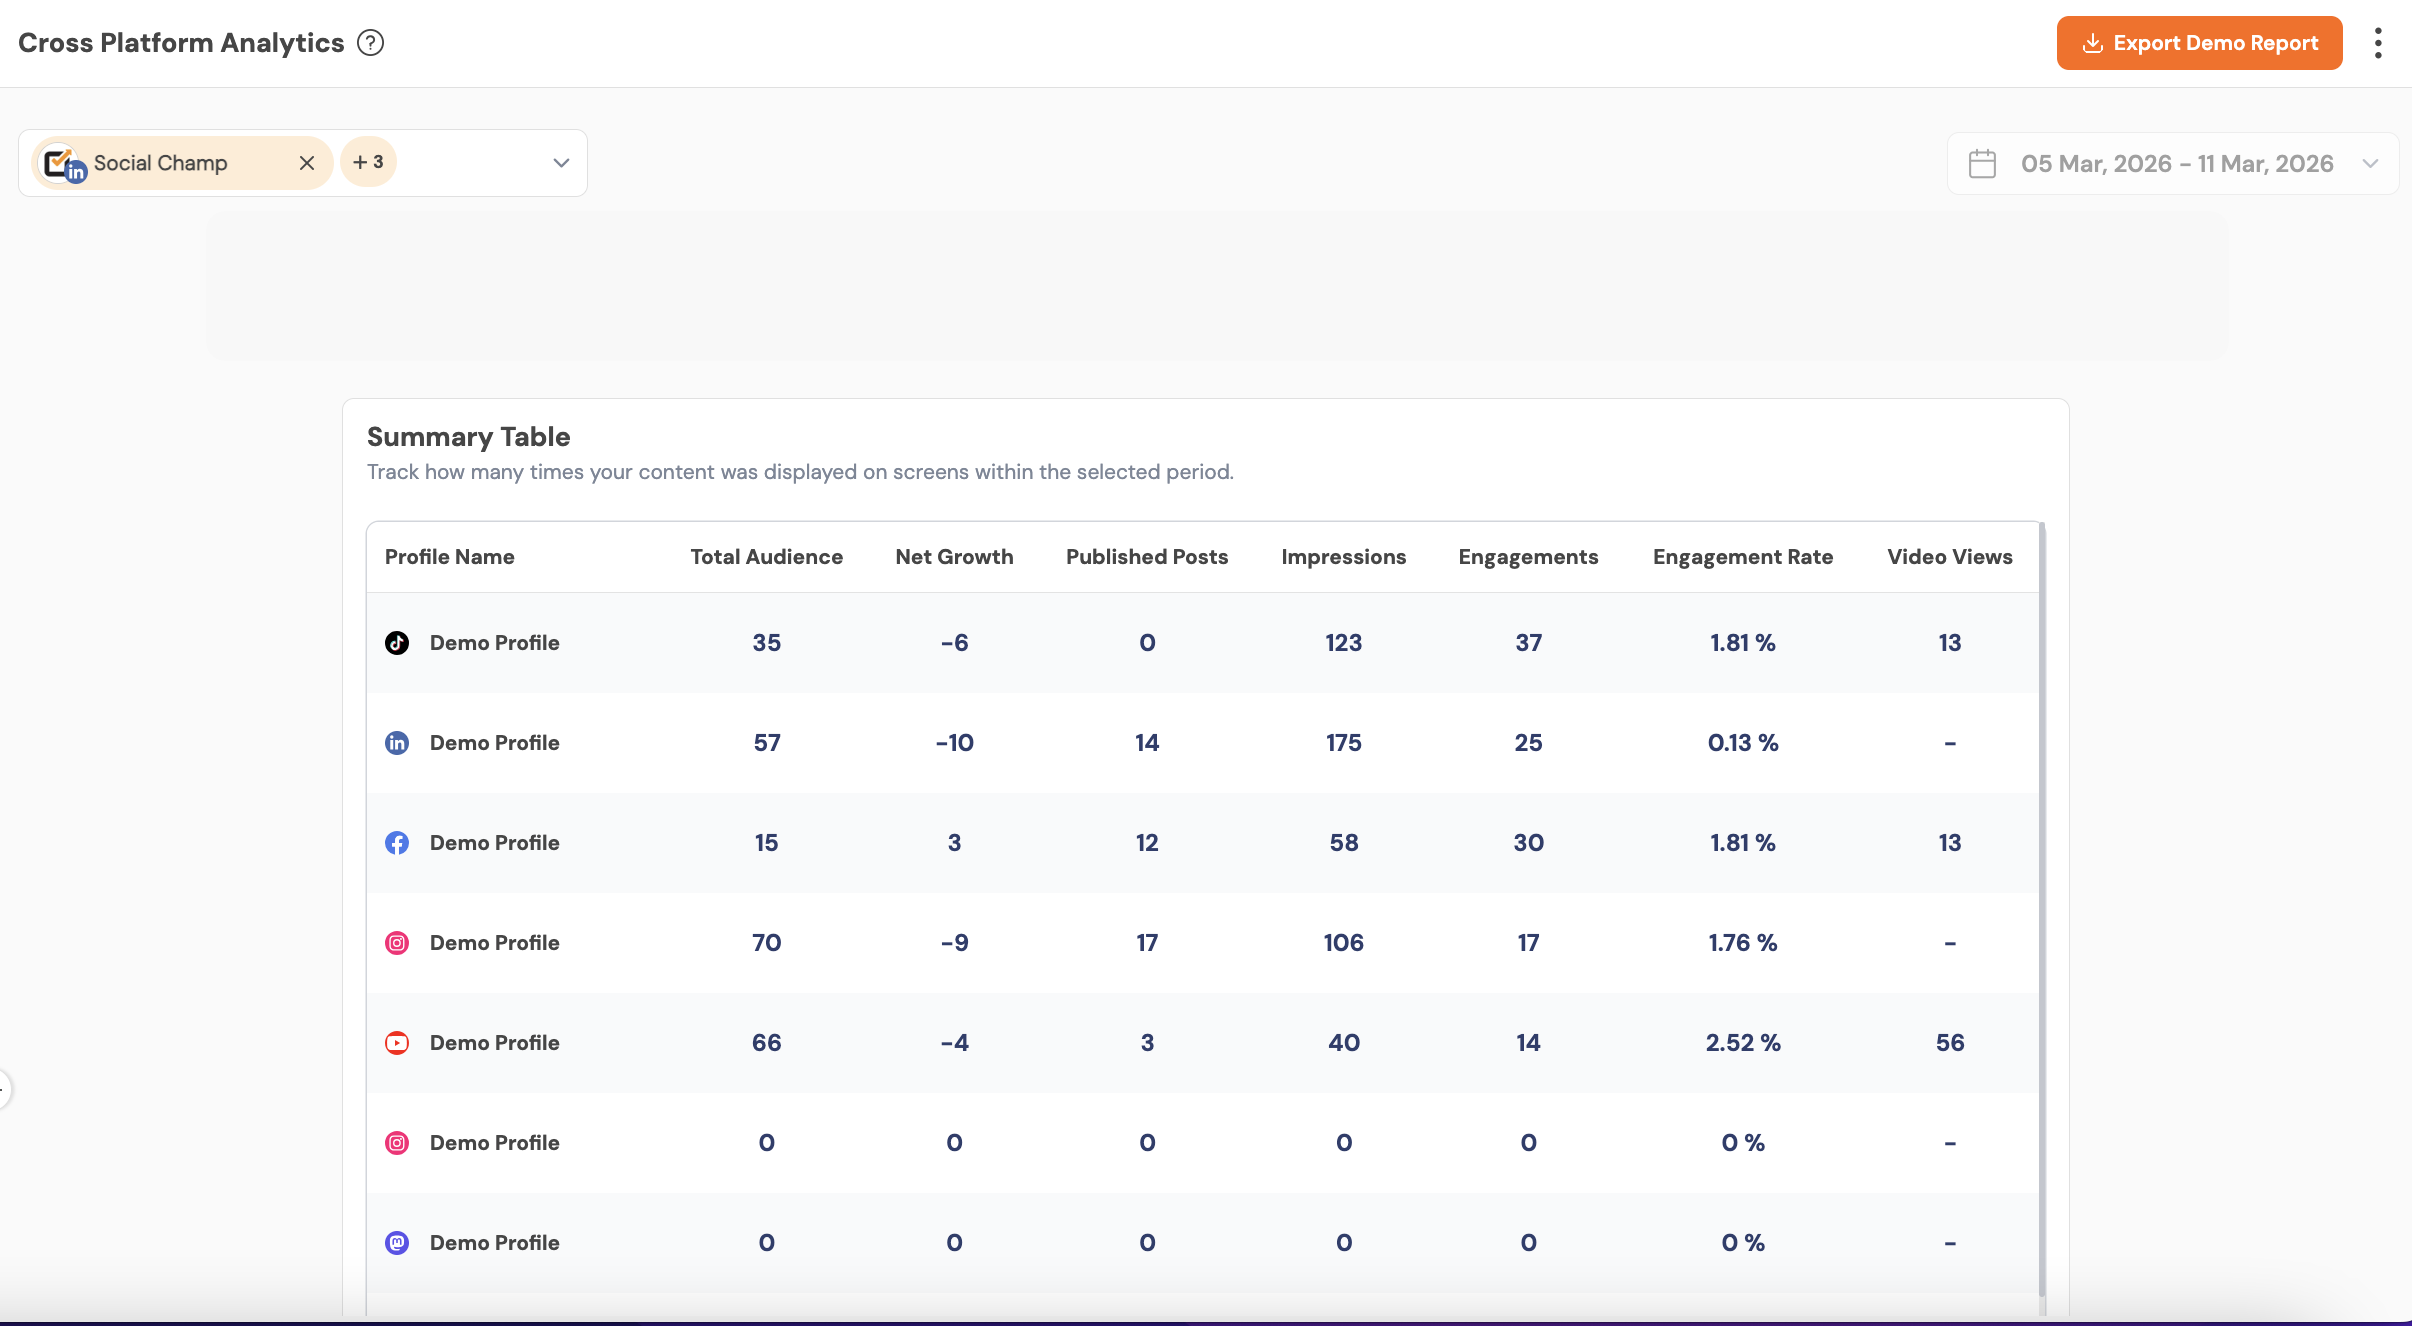
Summary Table
- A consolidated table listing core metrics per platform (e.g., Total Audience, Net Growth, impressions, engagements, and more). It enables side-by-side comparison, which allows for quick platform benchmarking.
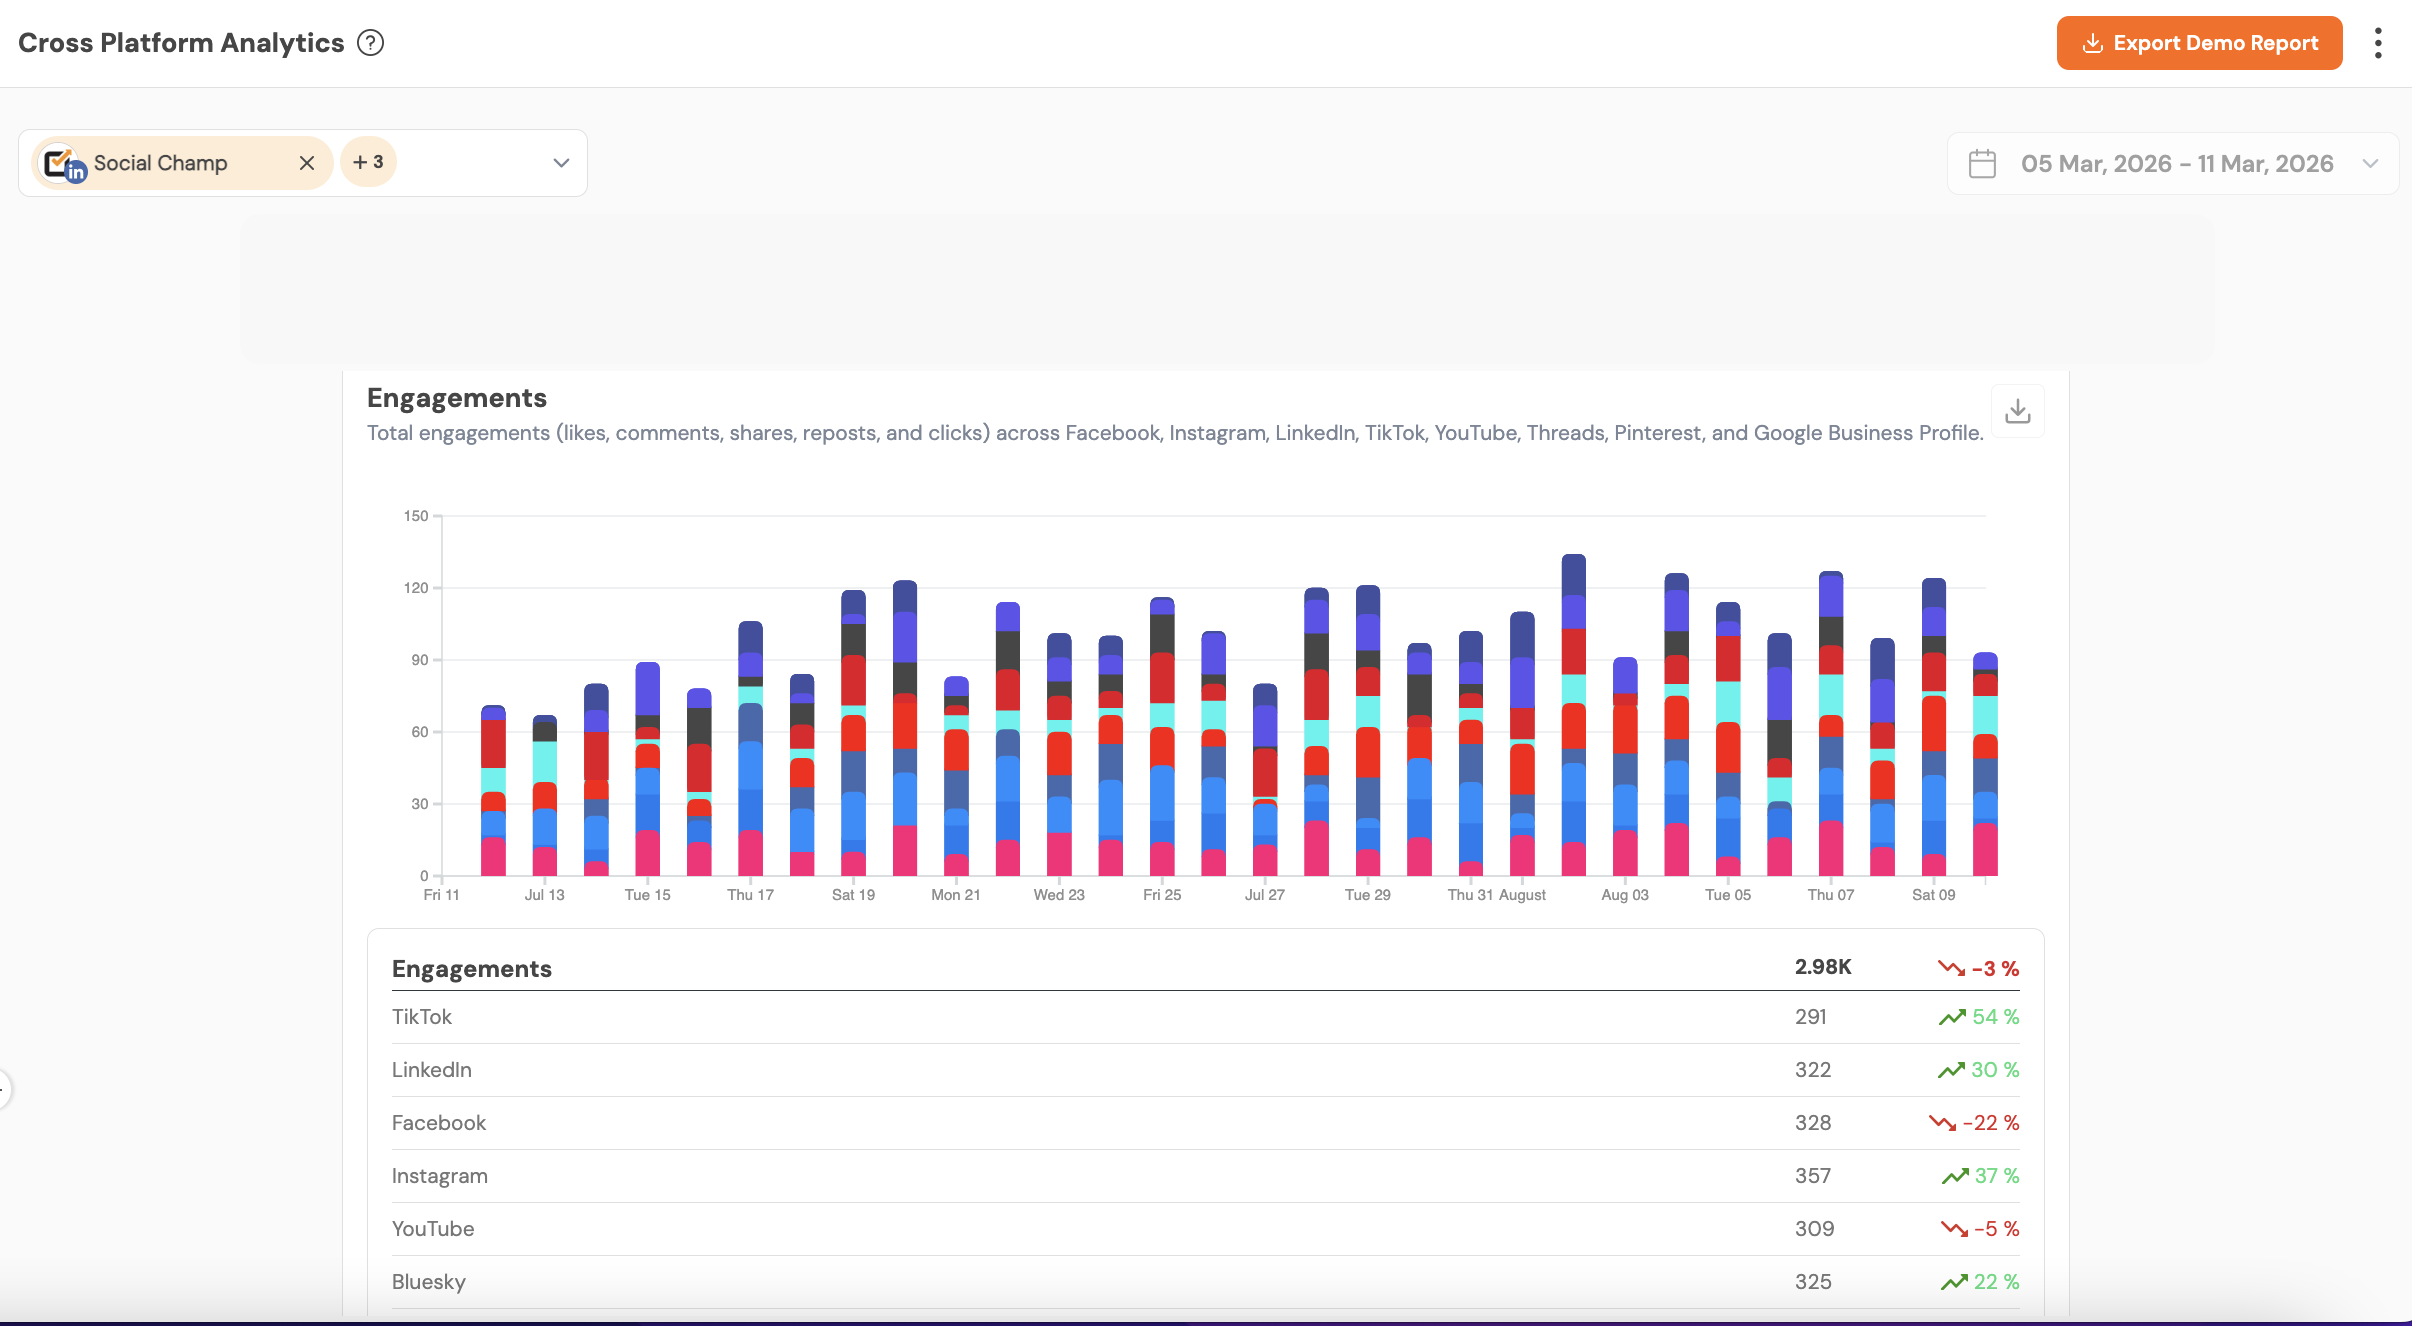
Engagements
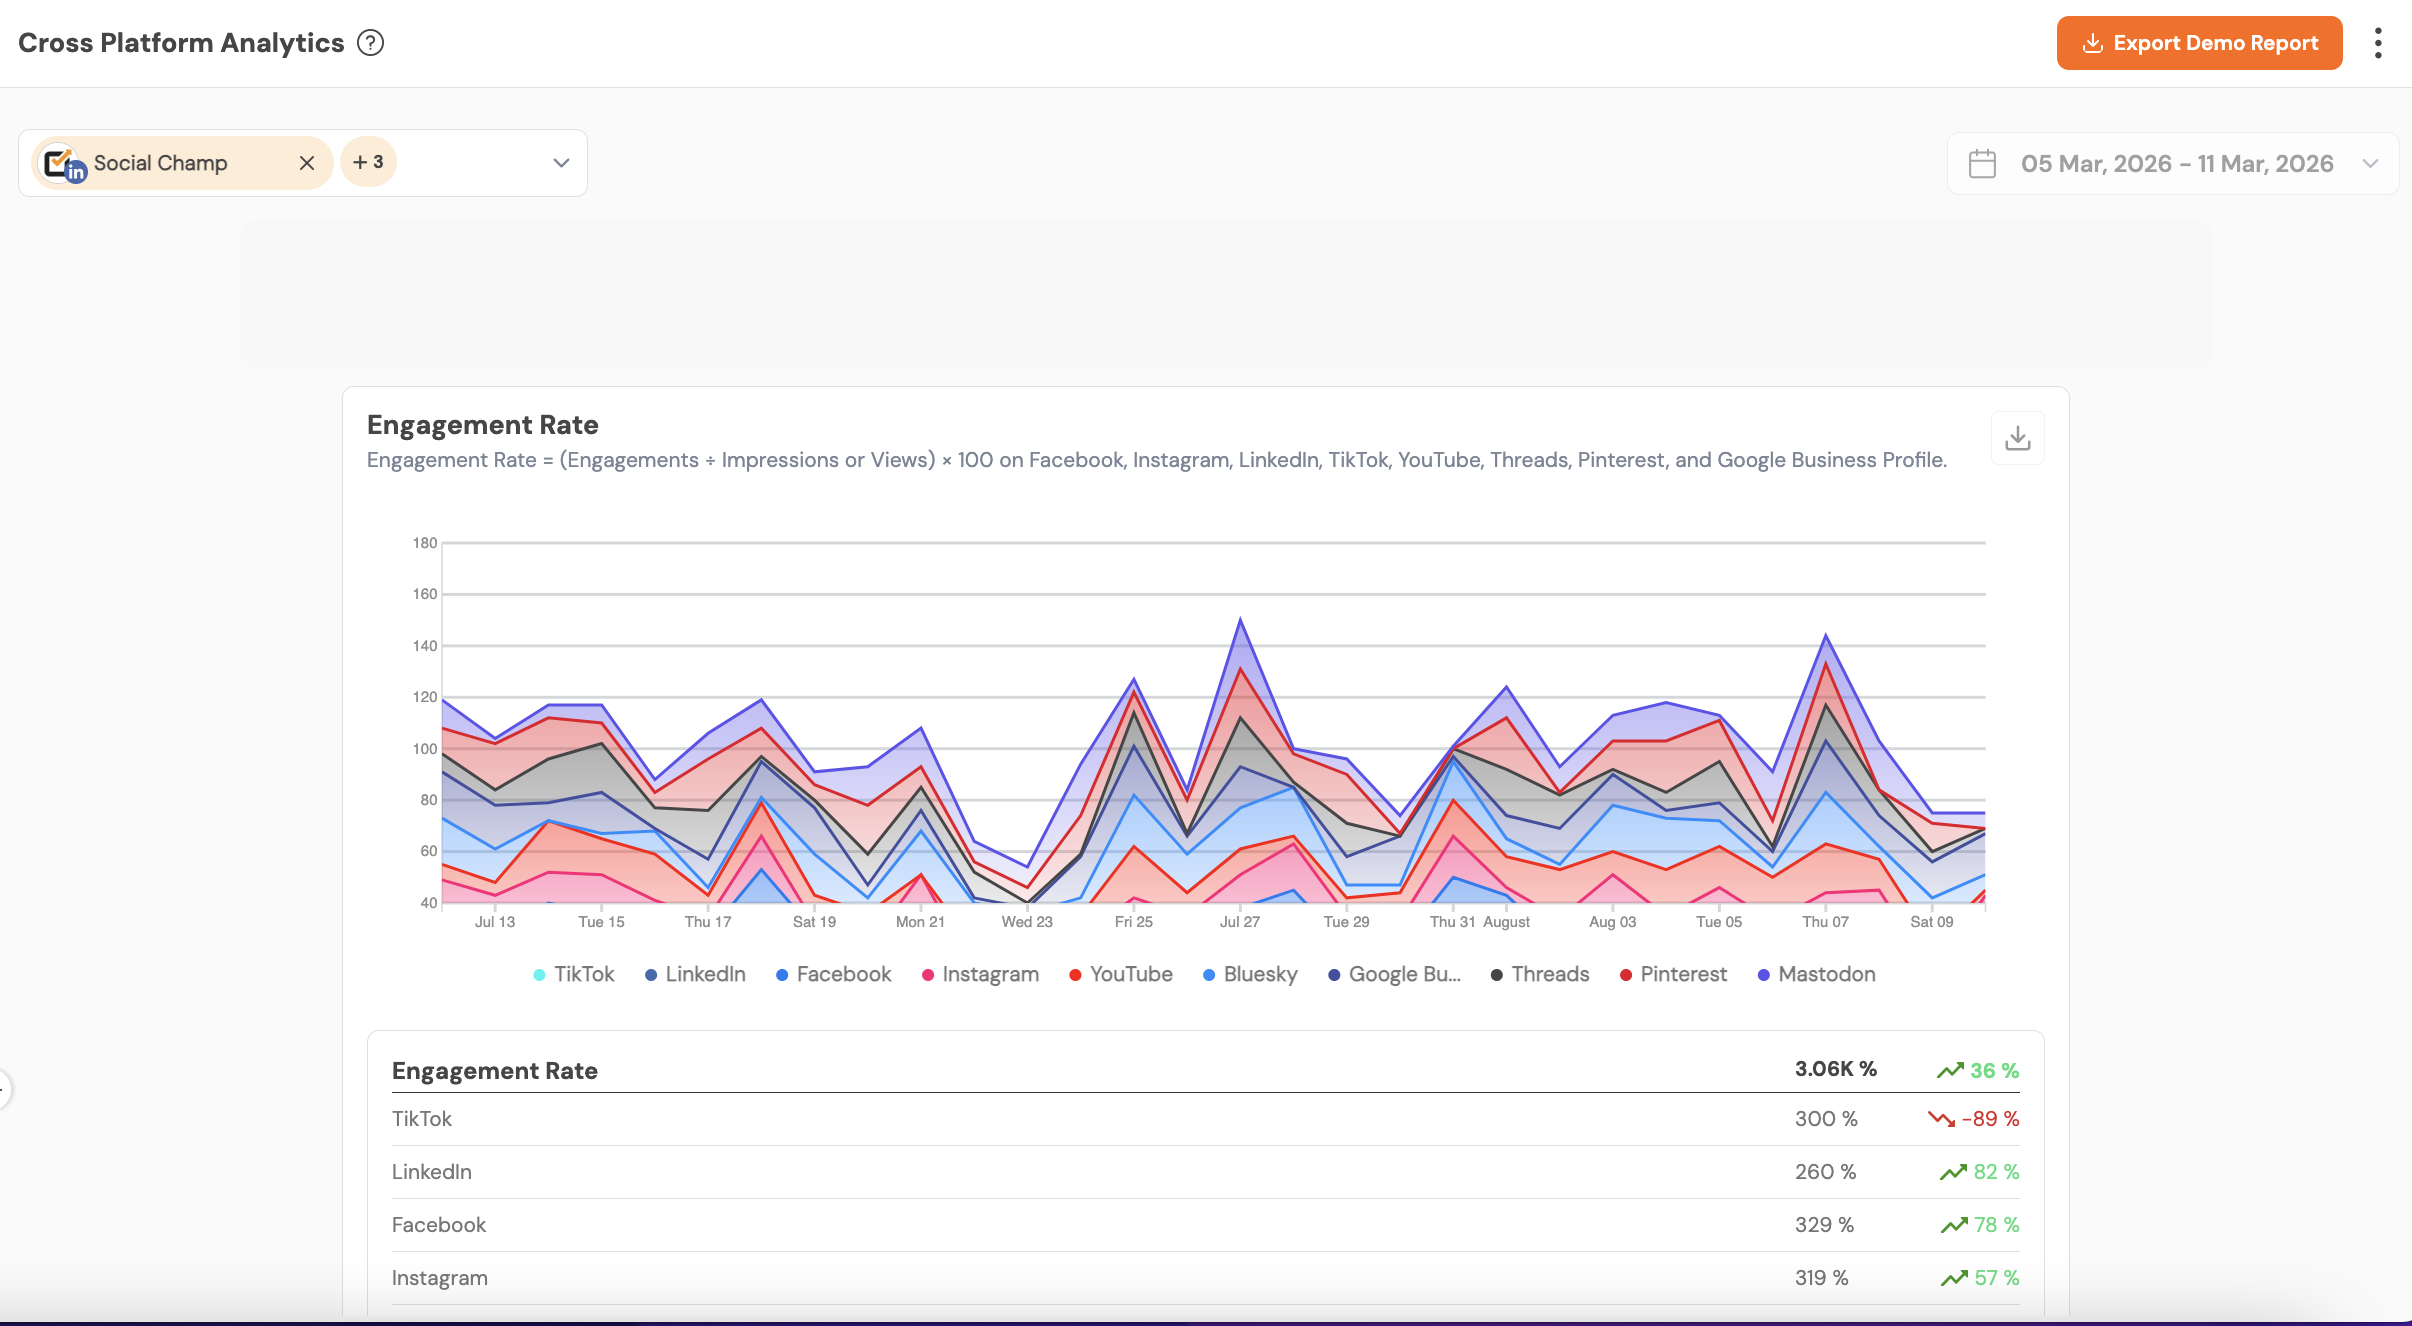
Total engagements (likes, comments, shares, reposts and clicks where applicable) across selected platforms and period. Engagements are an immediate indicator of how well audiences respond to your content.
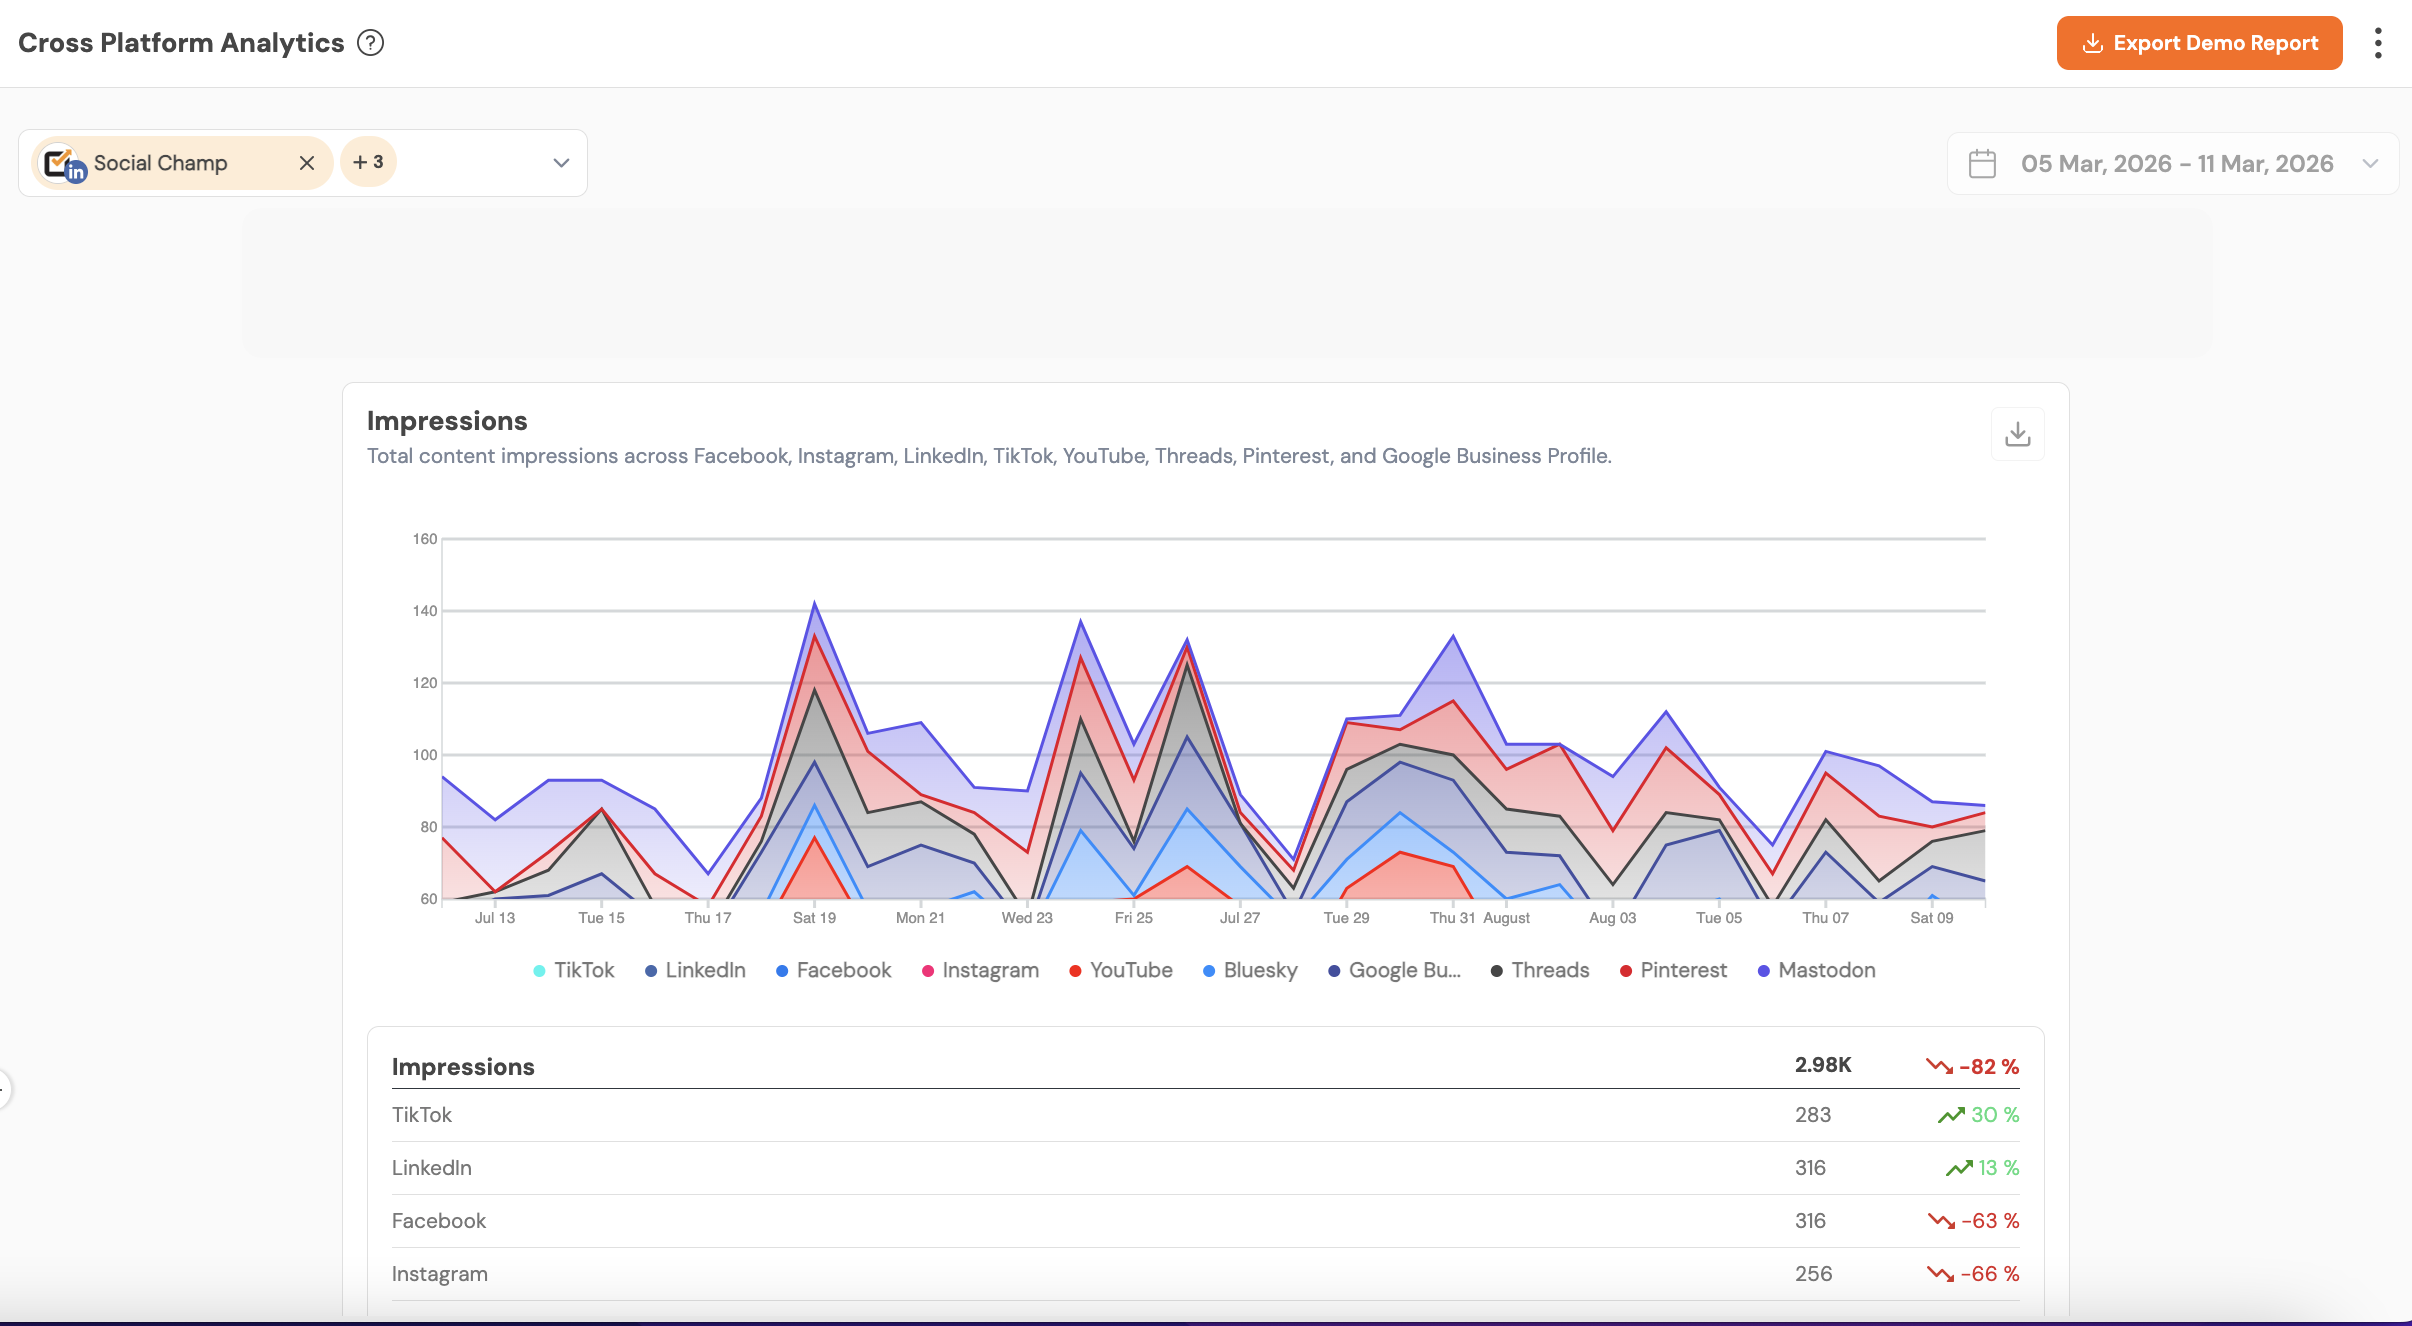
Impressions
Total impressions showing how many times content was displayed across feeds. Impressions measure content visibility, useful to evaluate reach.
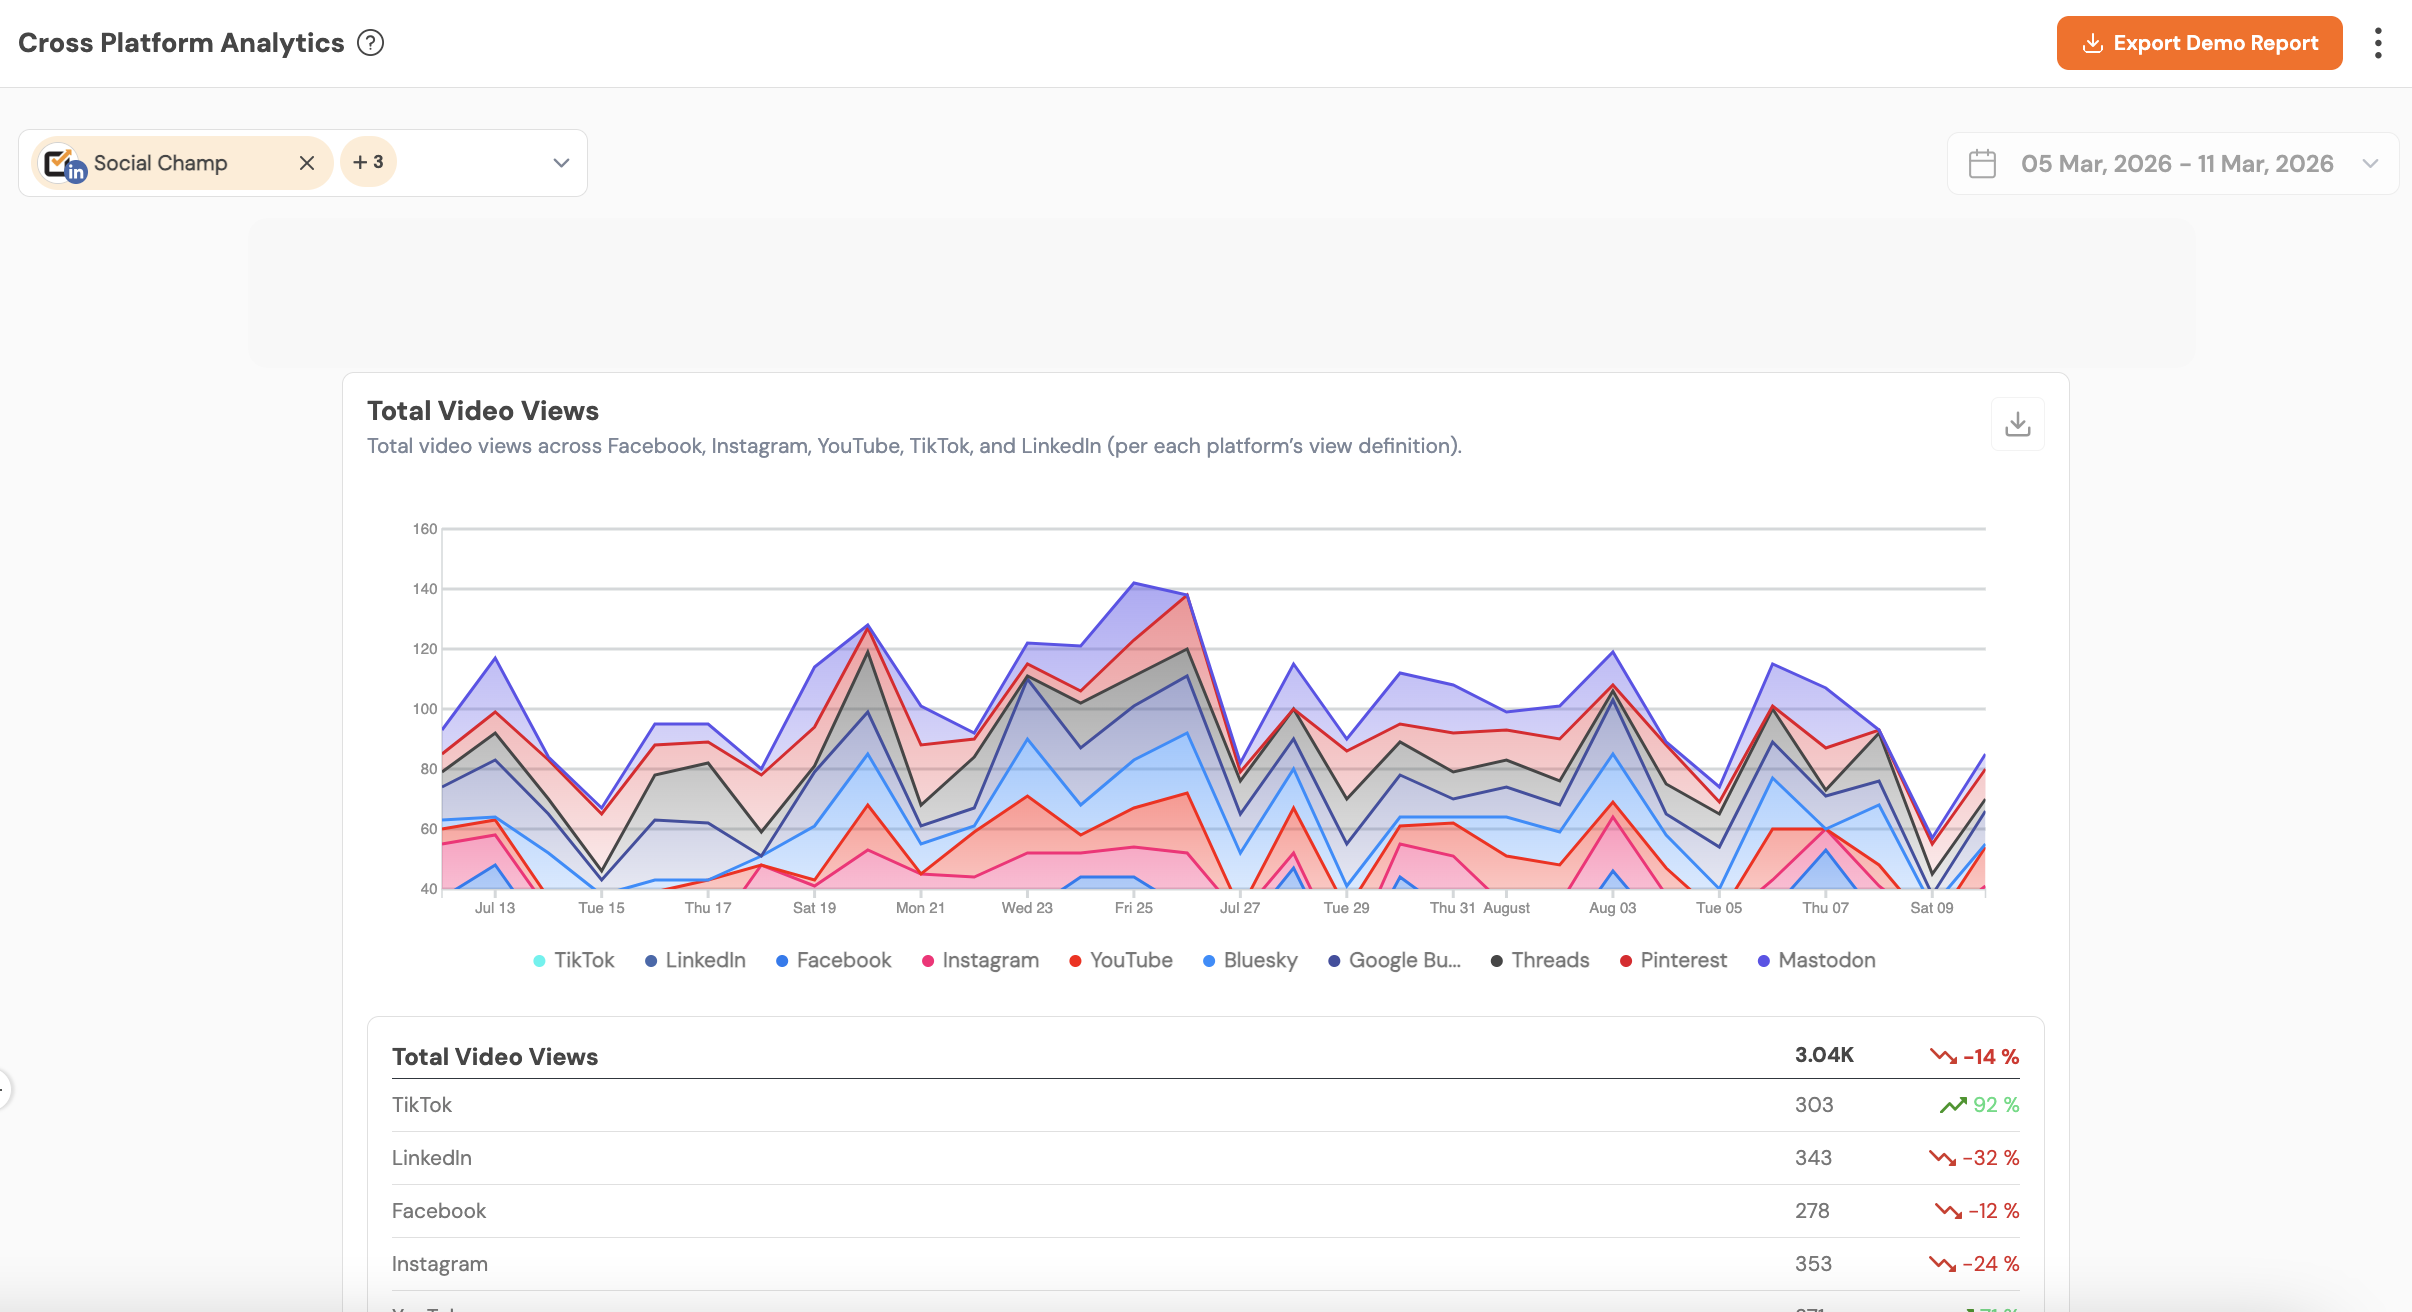
Total Video Views
Aggregated video play counts across platforms that support video views. Important for video-first strategies show which platforms and videos attract viewership.
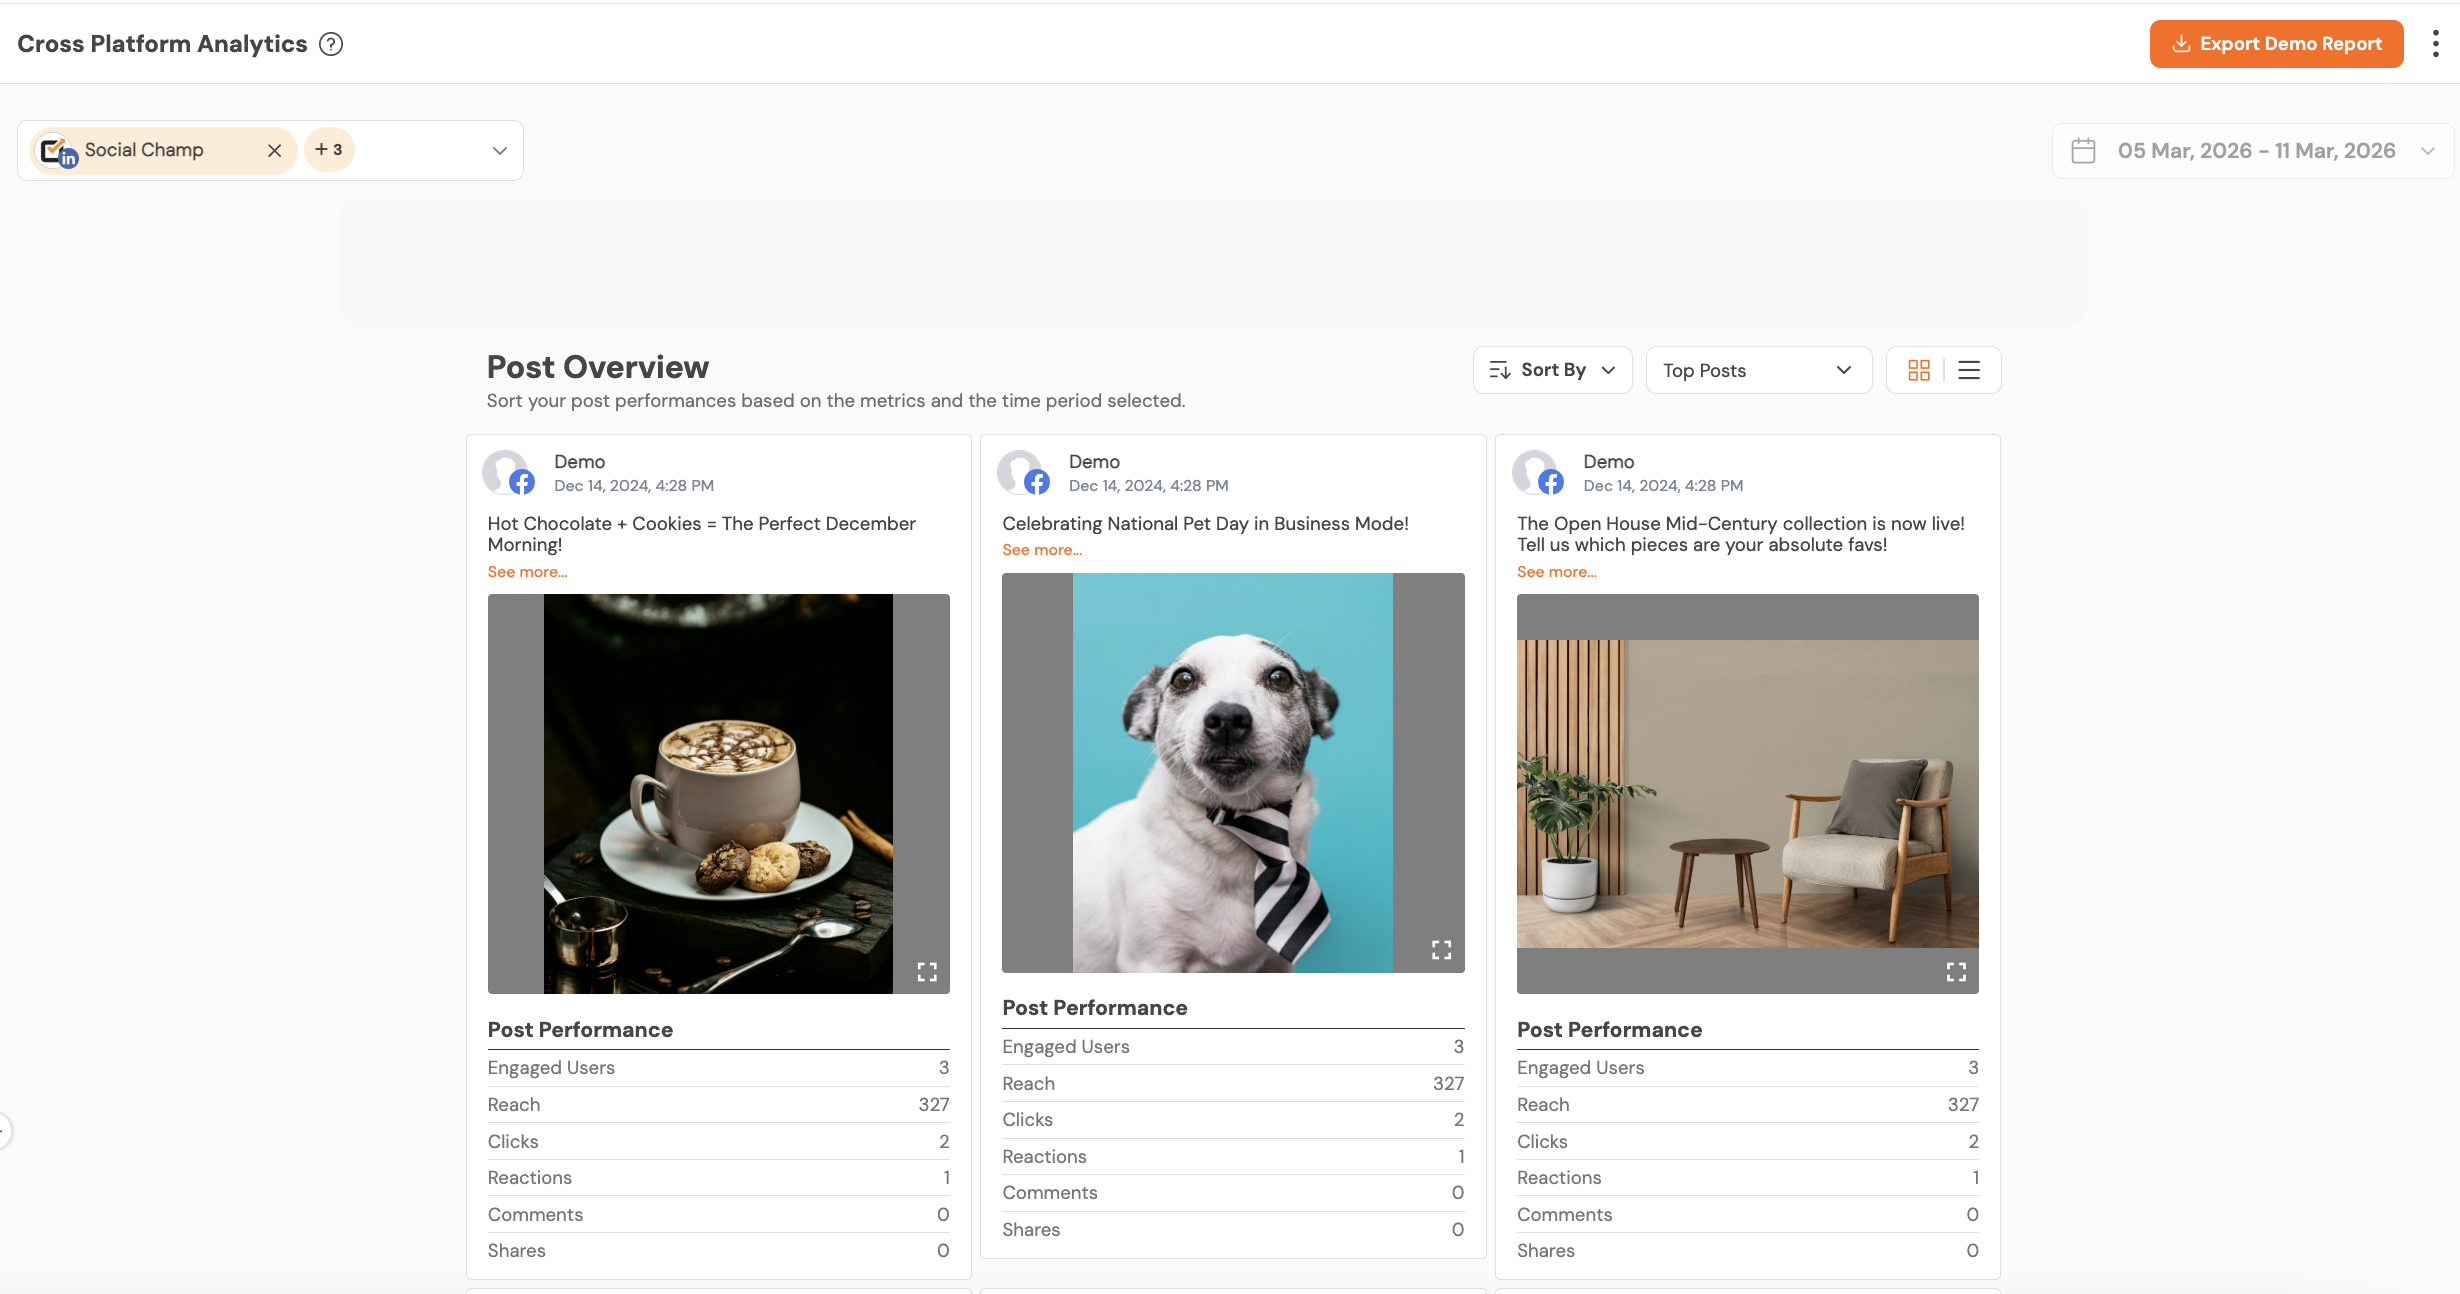
Post Overview
A sortable list of individual posts with columns for metric values (engagements, reach, click, reactions etc), lets you identify top- and bottom-performing posts across all networks.
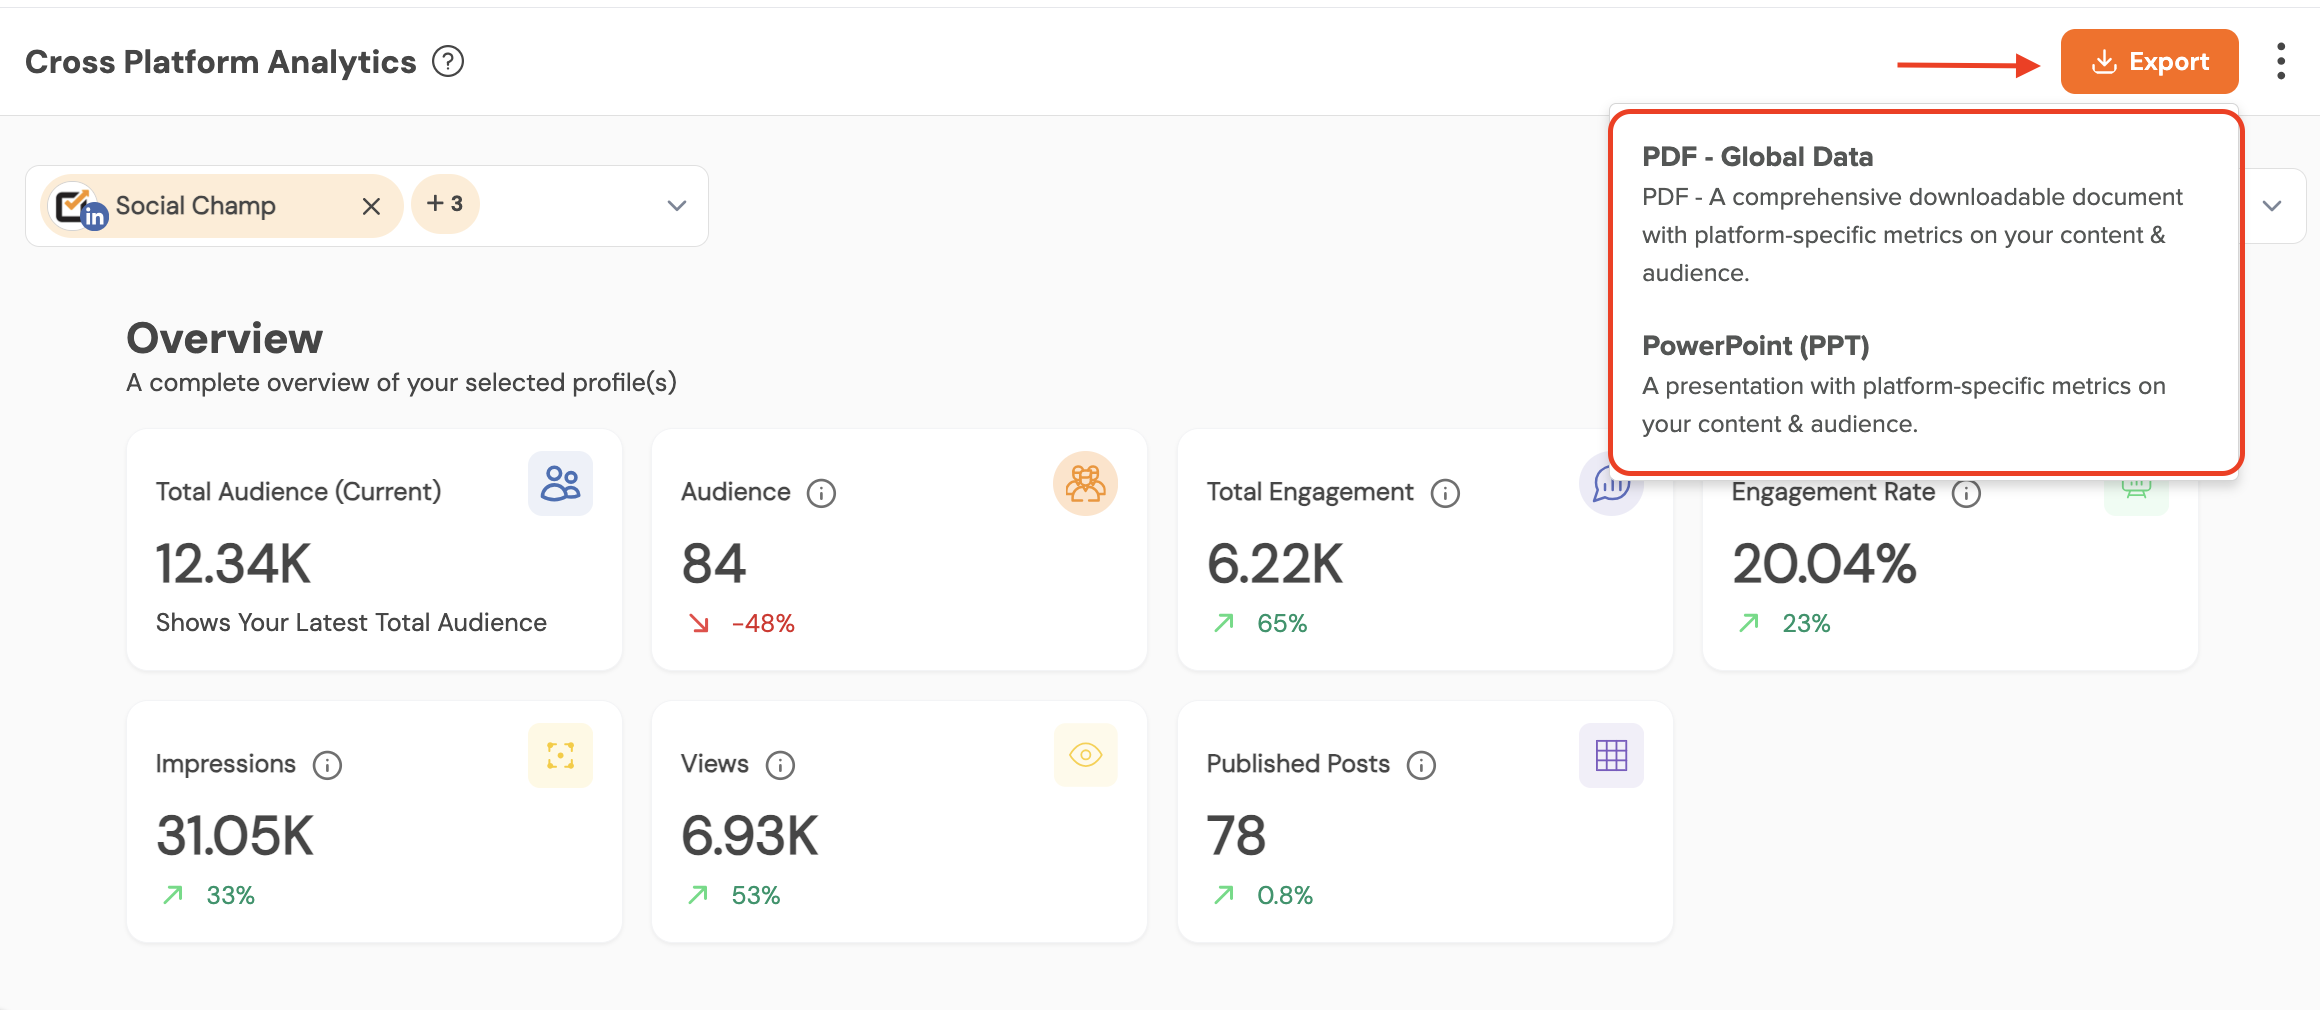
Export Report
You can export the reports in the PDF and PPT formats. You can make the reports white labelled by adding the logo, custom report name and cover title.
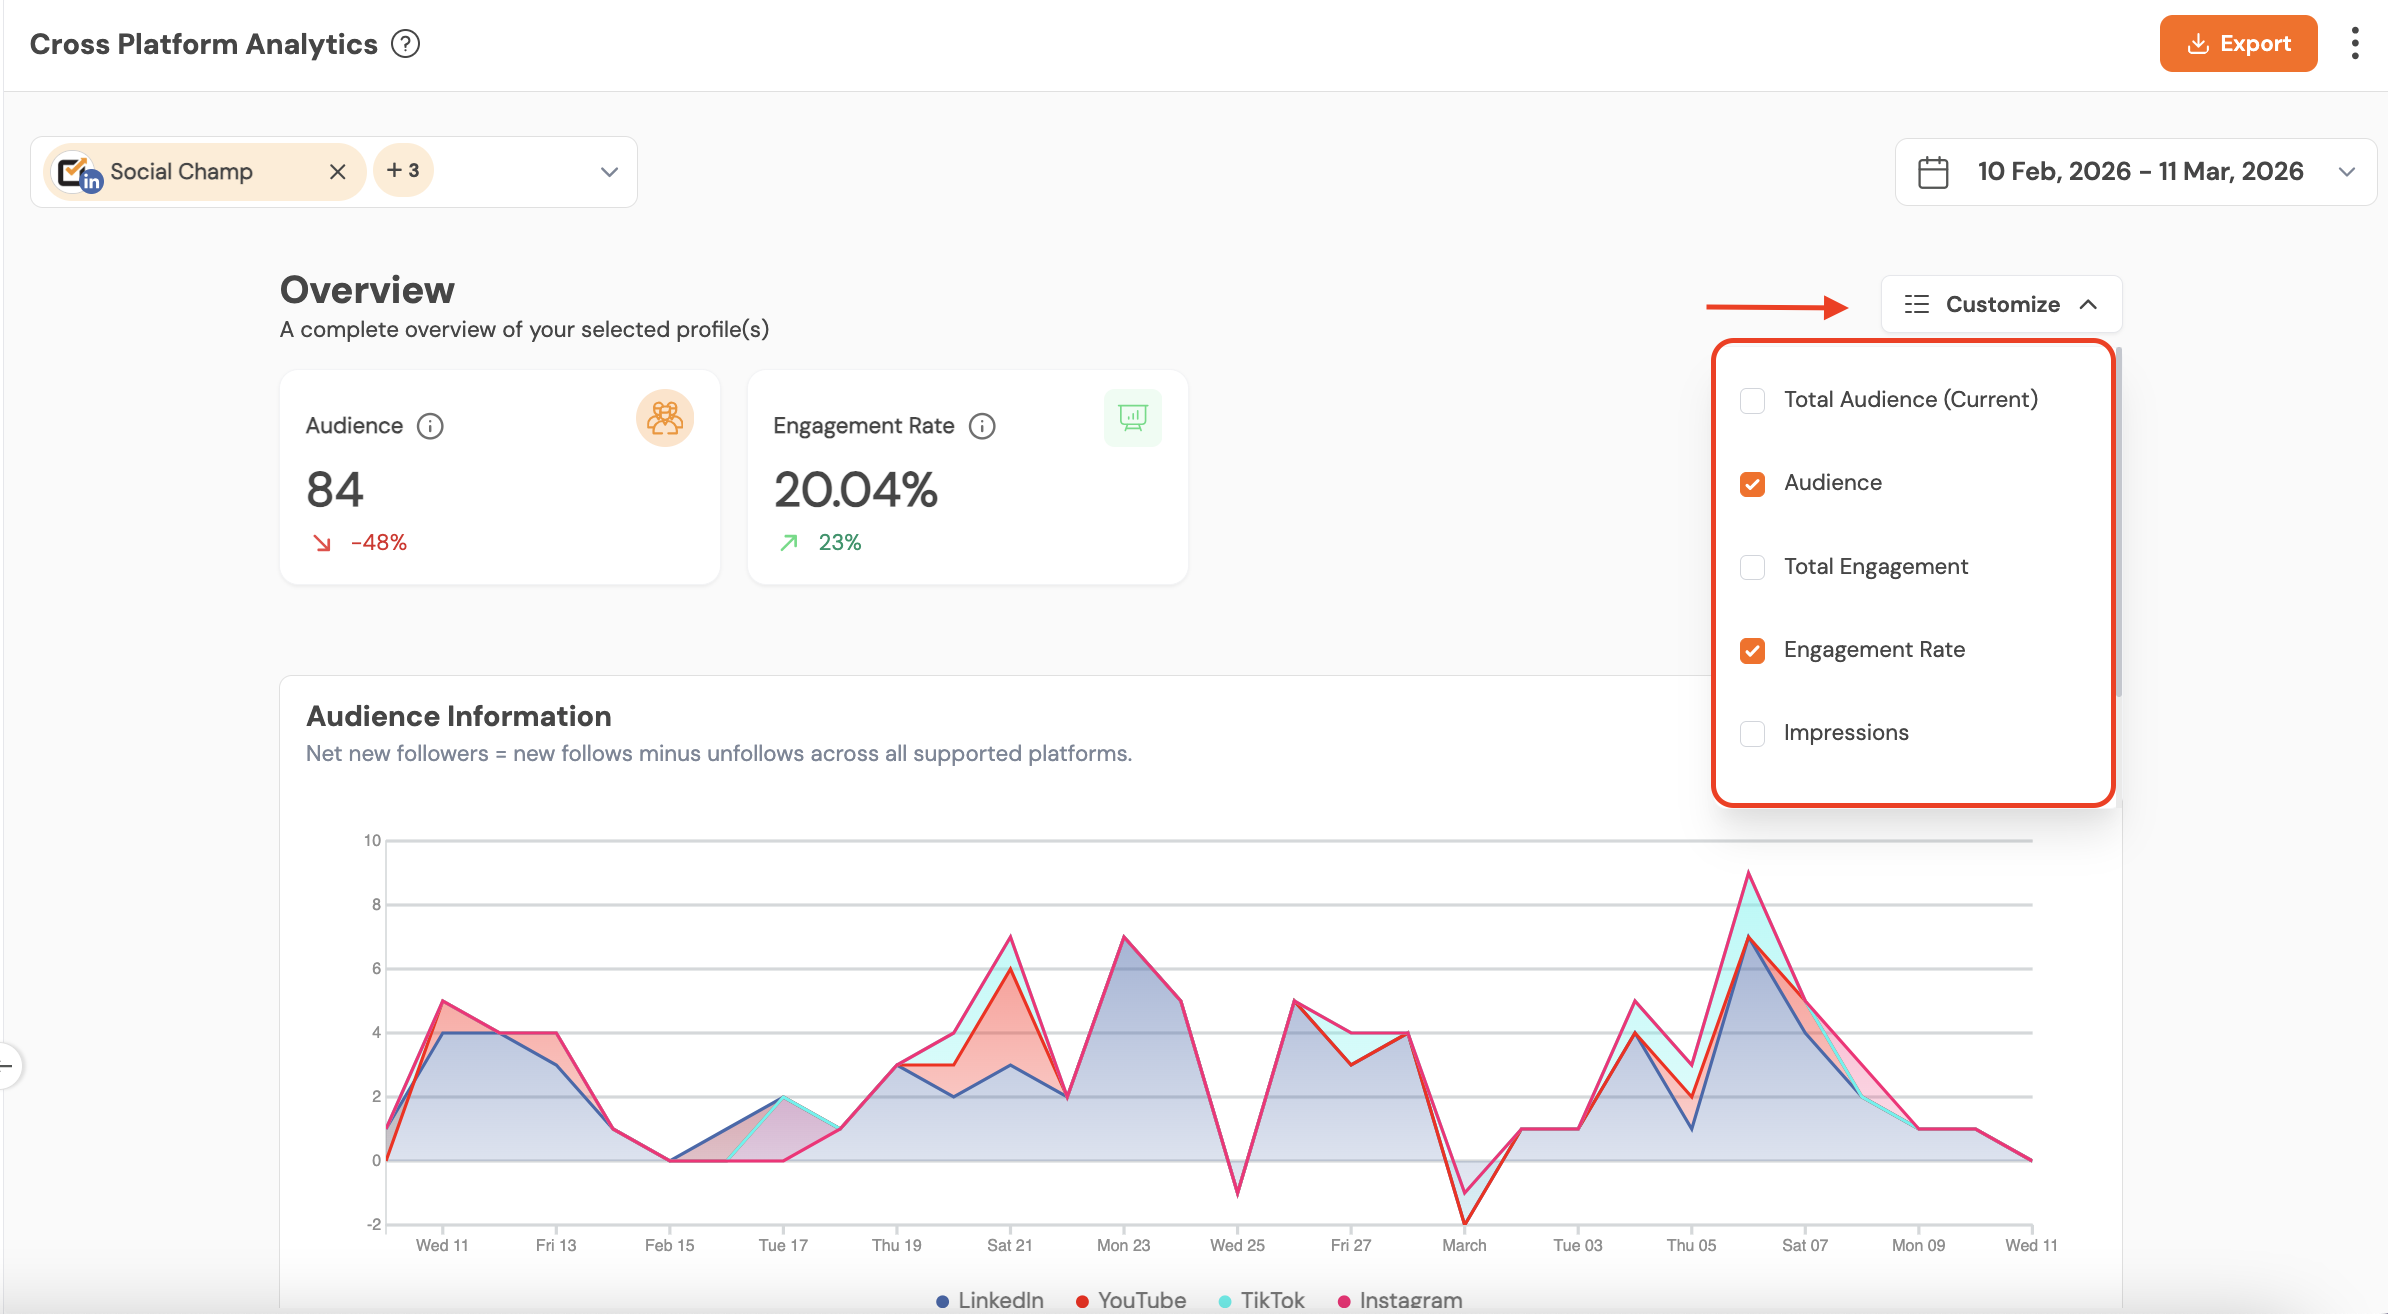
Customize Metrics
You can choose which metrics to include in the report. This helps you view only the metrics you are interested in and easily compare the platforms based on those metrics.
Note: Cross Platform Analytics is available on Growth Plan and Enterprise Plan
Get the Support you need:
Having trouble? Got a question? We’re here to support you every step of the way. Simply email us at support@socialchamp.com, and we’ll get back to you.
Hey Champ! Want to know how your content is really doing? Social Champ’s Analytics & Insights feature helps you keep Read more
With Social Champ’s Analytics feature, you can analyse your different social accounts and their posts for audience, engagement, impressions, and Read more
Hey Champs! Social Champ allows you to track the performance of campaigns and content via its In-app UTM tracking feature. Read more
Social Champ enables you to maximize your social media engagement by posting when your audience is most active. The "Best Read more